Download
1 / 1

E N D
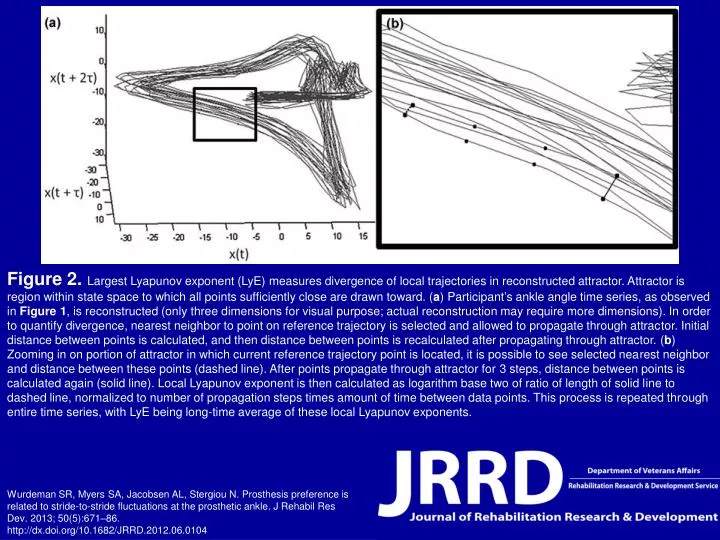
Figure 2. Largest Lyapunov exponent (LyE) measures divergence of local trajectories in reconstructed attractor. Attractor is region within state space to which all points sufficiently close are drawn toward. (a) Participant’s ankle angle time series, as observed in Figure 1, is reconstructed (only three dimensions for visual purpose; actual reconstruction may require more dimensions). In order to quantify divergence, nearest neighbor to point on reference trajectory is selected and allowed to propagate through attractor. Initial distance between points is calculated, and then distance between points is recalculated after propagating through attractor. (b) Zooming in on portion of attractor in which current reference trajectory point is located, it is possible to see selected nearest neighbor and distance between these points (dashed line). After points propagate through attractor for 3 steps, distance between points is calculated again (solid line). Local Lyapunov exponent is then calculated as logarithm base two of ratio of length of solid line to dashed line, normalized to number of propagation steps times amount of time between data points. This process is repeated through entire time series, with LyE being long-time average of these local Lyapunov exponents. Wurdeman SR, Myers SA, Jacobsen AL, Stergiou N. Prosthesis preference is related to stride-to-stride fluctuations at the prosthetic ankle. J Rehabil Res Dev. 2013; 50(5):671–86. http://dx.doi.org/10.1682/JRRD.2012.06.0104