Download
1 / 13
170 likes | 410 Views
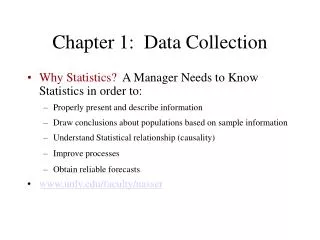
Business Statistics. Chapter 1 Introduction and Data Collection. Learning Objectives. In this chapter you learn: How Statistics is used in business The sources of data used in business The types of data used in business. Basic Concepts of Statistics. Statistics is concerned with:

E N D
Business Statistics Chapter 1Introduction and Data Collection
Learning Objectives In this chapter you learn: • How Statistics is used in business • The sources of data used in business • The types of data used in business
Basic Concepts of Statistics Statistics is concerned with: • Processing and analyzing data • Collecting, presenting, and transforming data to assist decision makers
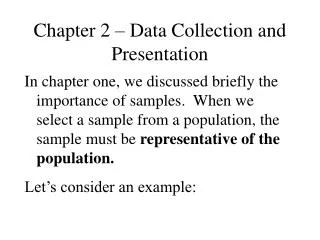
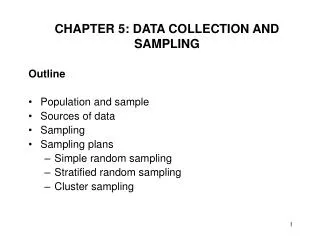
Key Definitions • A population (universe) is the collection of all members of a group • A sample is a portion of the population selected for analysis • A parameter is a numerical measure that describes a characteristic of a population • A statistic is a numerical measure that describes a characteristic of a sample
Population vs. Sample Population Sample a b c d ef gh i jk l m n o p q rs t u v w x y z b c g i n o r u y Measures used to describe a population are called parameters Measures computed from sample data are called statistics
Two Branches of Statistics • Descriptive statistics • Collecting, summarizing, and presenting data • Inferential statistics • Drawing conclusions about a population based only on sample data
Descriptive Statistics • Collect data • e.g., Survey • Present data • e.g., Tables and graphs • Characterize data • e.g., Sample mean =
Inferential Statistics • Estimation • e.g., Estimate the population mean weight using the sample mean weight • Hypothesis testing • e.g., Test the claim that the population mean weight is 120 pounds Drawing conclusions about a populationbased on sample results.
Collecting Data Primary Data Collection Secondary Data Compilation Print or Electronic Observation Survey Experimentation
Types of Data Examples: • Marital Status • Political Party • Eye Color (Defined categories) Examples: • Number of Children • Defects per hour (Counted items) Examples: • Weight • Voltage (Measured characteristics)
Levels of Measurementand Measurement Scales Differences between measurements, true zero exists Highest Level (Strongest forms of measurement) Ratio Data Differences between measurements but no true zero Interval Data Higher Levels Ordered Categories (rankings, order, or scaling) Ordinal Data Lowest Level (Weakest form of measurement) Nominal Data Categories (no ordering or direction)
Levels of Measurementand Measurement Scales EXAMPLES: Height, Age, Weekly Food Spending Ratio Data Differences between measurements, true zero exists Temperature in Fahrenheit, Standardized exam score Interval Data Differences between measurements but no true zero Service quality rating, Standard & Poor’s bond rating, Student letter grades Ordinal Data Ordered Categories (rankings, order, or scaling) Marital status, Type of car owned Nominal Data Categories (no ordering or direction)
Chapter Summary • Reviewed basic concepts of statistics: • Population vs. Sample • Parameter vs. Statistic • Primary vs. Secondary data sources • Defined descriptive vs. inferential statistics • Reviewed types of data and measurement scales • Categorical vs. Numerical data • Discrete vs. Continuous data • Nominal and Ordinal scales • Interval and Ratio scales