Download
1 / 31
310 likes | 448 Views
Tracking Structural Development Processes through the Inter-group Cohesion Index. John Cameron & Yih Lerh Huang ISS. “ All happy families are alike; each unhappy family is unhappy in its own way.” – Tolstoy, in Anna Karenina. What is Socia l Cohesion?.

E N D
Tracking Structural Development Processesthrough the Inter-group Cohesion Index John Cameron & YihLerh Huang ISS
“All happy families are alike; each unhappy family is unhappy in its own way.” – Tolstoy, in Anna Karenina
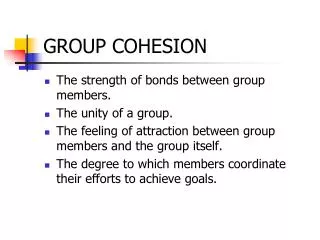
What is Social Cohesion? “the ongoing process of developing a community of shared values, shared challenges and equal opportunity within Canada, based on a sense of trust, hope and reciprocity among all Canadians” Policy Research Sub-Committee on Social Cohesion (Canada) “a set of social processes that help instil in individuals the sense of belonging to the same community and the feeling that they are recognised as members of that community” Commissariat Général du Plan (France)
Multi-dimensional Belonging Inclusion Participation Recognition Legitimacy Isolation Exclusion Non-involvement Rejection Illegitimacy Common values Social order Social solidarity Social networks Place attachment Civic culture Social control Wealth disparities Social capital Identity Jenson (1998) Kearns and Forrest (2000) Equality Inequality Rajultonet al. (2007)
The ISS Inter-group Cohesion Index measures “the extent to which there is social cohesion between defined religious, ethnic, and linguistic groups, without degeneration into civil unrest or inter-group violence” Indices of Social Development: Project Overview (2011)
Indicators: • Violent Demonstration • Deaths in Conflict • Inter-group Grievances • Civil Disorder • Internal Conflict • Terrorism Risk • Minority Rebellion Score • Log assassinations per log capita • Log guerrilla acts per log capita • Log riots per log capita • Terrorism • Log terrorist acts per log capita
Inter-group Cohesion Index Summary ObsMean Std. Dev. Min Max 1990 106 .5899623 .1009363 .0000000 .7447424 1995 103 .6572793 .0919776 .3840644 .8023122 2000 116 .5996492 .1341715 .2491713 .8744453 2005 158 .6093794 .0760247 .3515432 .7420220 2010 158 .5528531 .0854517 .0800696 .7008806 Includes all countries with a score for that chronological data-point
Adverse events and the onset and depth of declines • 1997 Asian Financial Crisis • Post-9/11 • ‘War on Terror’
Low Income Group Peaked around 1995 Peaked around 2000
Lower Middle Income Group Peaked around 1995 Peaked around 2000
Upper Middle Income Group Peaked around 1995 Peaked around 2000
HighIncome Group Peaked around 1995 Peaked around 2000
10 post-peak change: gdppcvs Inter-group Cohesion – High Income
10 year change (2000-2010): gdppcvs Inter-group Cohesion – Upper Income
Clubs & Associations Index’s correlation with Inter-group Cohesion Index
Conclusion • Significant decline in the Inter-group Cohesion Index between 1995 and 2010. • Some ‘regional’ differences in the timing of the downturn • Greater resilliance in Cohesion scores and less impact on gdppcgrowth rates in the 1995 cohort even when controlling for initial gdppclevels using two approaches • ‘varieties of capitalism’ • Small group solidarity as a response to structural insecurities
10 post-peak change: gdppcvs Inter-group Cohesion – Lower Income
10 post-peak change: gdppcvs Inter-group Cohesion – Lower Middle Income
10 post-peak change: gdppcvs Inter-group Cohesion – Upper Middle Income