Download
1 / 20
200 likes | 207 Views
Session 4: Open session on the development of Green GDP accounting in Vietnam. Jean-Louis Weber Special Adviser on Economic Environmental Accounting European Environment Agency jean-louis.weber@eea.europa.eu jlweber45@gmail.com. CENTRAL INSTITUTE FOR ECONOMIC MANAGEMENT

E N D
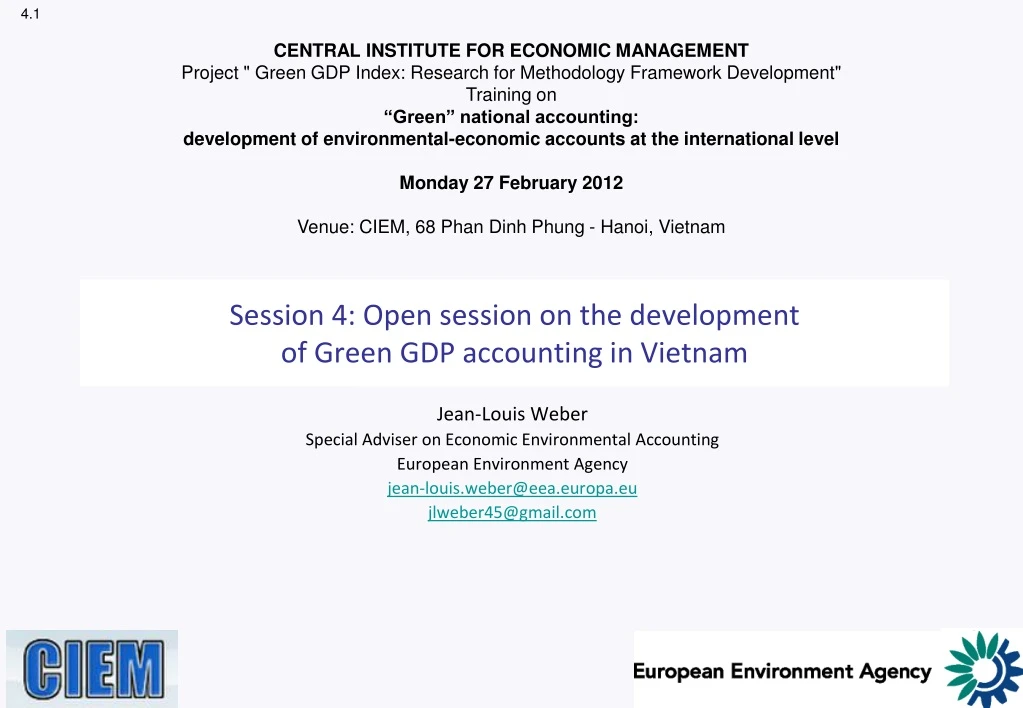
Session 4: Open session on the development of Green GDP accounting in Vietnam Jean-Louis Weber Special Adviser on Economic Environmental Accounting European Environment Agency jean-louis.weber@eea.europa.eu jlweber45@gmail.com CENTRAL INSTITUTE FOR ECONOMIC MANAGEMENT Project " Green GDP Index: Research for Methodology Framework Development" Training on “Green” national accounting:development of environmental-economic accounts at the international level Monday 27 February 2012 Venue: CIEM, 68 Phan Dinh Phung - Hanoi, Vietnam
4.2 “Green GDP”: where to go? how to start? • Do we need to value Nature beyond economic assets? How far should we try to put a price on free goods and services? • Weak/ Strong sustainability • NPV, usefulness and limitation for measuring natural assets depletion; the El Serafy method as a simplest solution. • Valuation of ecosystem services: many methods; micro vs. macro perspectives • Practical issues: “benefit transfers”. • Ecosystem capital maintenance, depreciation and assessment of remediation/restoration costs. • Ecosystem and Human capital. • Which adjustments of the national accounts are the more operational? • True GDP or National Income? Final Consumption at Full price? • Prices issues in national accounts: the GDP of the Poor paradigm • Measuring ecological debts and assets (good ecosystem state) Jean-Louis Weber, 27 February 2012
4.14 Valuation and national accounts • Consistency of “accounting prices” • Contingent valuations marginal price, ex ante, which includes “consumer surplus” (what we are ready to pay…) • Statistics mean price, ex post observation, no “consumer surplus” (what we have actually paid) • Production adjustment: depletion vs degradation (Vanoli) • Resource depletion is part of commodities prices can be deducted from GDP (or from National Income); it cannot be added to Final Consumption • Degradation is not paid cannot be deducted from GDP, but additional capital consumption can be deducted from NDP or Net National Income; it can be added to Final Consumption • The past cannot be re-written, GDP adjustment is modelling future • GDP is the result of an economic equilibrium in which prices and consumption have been established; national accounts record the past we cannot change one price without changing the complete consumption structure GDP adjustments are modelling, only valid for future (“what will be the GDP under constraint of paying for additional environmental norms…”) OR: balancing the “green” adjustment by ecological debts… Jean-Louis Weber, 27 February 2012
4.15 Weak versus Strong Sustainability • Weak Sustainability • Maintain National Income by maintaining all forms of capital (Hartwick, Kirk Hamilton…) (possible?) • Maintain National Income against depletion of natural resources (El Serafy, SEEA) • Strong Sustainability • Maintain the ecosystems… not possible • Maintain the ecosystem capacity to deliver services (+ maintain and improve man made and human capitals) • Aggregates : • GDP Adjusted from environmental damages (is it computable?) W • Net Adjusted Savings W or S ? • NDP or Net National Income Adjusted from 1) resource depletion W • NDP or Net National Income Adjusted from 2) ecosystem degradation (including urban and agricultural systems) S • Final Consumption (and Imports and Exports) at the full price (including unpaid degradation) S • Ecological debts (and assets) S Jean-Louis Weber, 27 February 2012
4.7=1.32 Natural capital approach and GDP adjustment: the maintenance approach Natural capital depreciation, what National Accounts should record: adjustment of National Income and Final Consumption Gross Domestic Product (GDP) – or + Transfers with the Rest of World = Gross National Income (GNI) _ Consumption of Fixed Capital = National Income (NI or NNP) -- Depletion of subsoil assets -- Consumption of (domestic) ecosystem capital = Final Consumption at Purchaser’s Price Consumption of ecosystem capital embedded in Imports (minus in Exports) = + + Final Consumption at Full Cost of Commodities Adjusted Real Net National Income Jean-Louis Weber, 27 February 2012
4.3=3.9 What can we measure and value? Invaluableasset no monetary value… Paid maintenance/ restoration costs Quantities (surface, tons of stones…) AND Qualities (aesthetical, functional…) Physical degradation (not yet repaired) = Physical debt Various services, of which some are valuable (e.g. tourism) or not (e.g. religion) Estimated cost of repairs (not yet paid) = Capital depreciation = Monetary debt Jean-Louis Weber, 27 February 2012
4.4=3.6A Ecosystems are altogether private and public goods + Good quality of water, air + Good state of the ecosystems (soil, biodiversity, resilience…) From Chichilnisky (1997), Costanza, (2009) Jean-Louis Weber, 27 February 2012
4.19 Valuation of ecosystem services: many possible methods, not all compatible with National Accounts S, the Total Economic Value is a myth… Jean-Louis Weber, 27 February 2012
The narrative behind Ecosystem Capital Accounts:h.Ecosystem Capital should not be valued; ecosystem services can be valued one by one but are not fully additive (functional analysis) 1 2 3 4 5 n Ecosystem services valuation Bottom-up, individual preferences, market and shadow prices, Costs-Benefits Analysis, General Equilibrium model Service n value ?? Service n Service 5 value ? Service 5: e.g. existence Service 4 value Service 4: e.g. water regulation Service 3 value Service 3: e.g. eco-tourism Service 2 value Service 2: e.g. fish provision Service 1 value Service 1: e.g. timber provision Ecological Taxes, Subsidies, Tradable Offset Certificates / Depreciation... 4.9=3.27 National Accounts = the macro-economic picture adjusted for natural capital depreciation Benefits & Costs Assessments = accounts for projects, sectors… Ecosystem capital 2 Stocks & flows Health Land cover Biomass/Carbon Soil Biodiversity Water catchments Sea Atmosphere Vigour Organisation Resilience Autonomy Healthy populations Operationcosts E.S n Operationcosts E.S 5 Operationcosts E.S 4 Operation costs E.S 3 Operation costs E.S 2 Service 2: e.g. fish provision Operation costs E.S 1 Ecosystem / public good protection (all services) Ecosystem restoration costs Top-Down, collective preferences, multi-criteria decision (economic & social values, long term targets…), Consumption of Ecosystem Capital Jean-Louis Weber, 27 February 2012
The narrative behind Ecosystem Capital Accounts:i. To address multiple scales, ecosystem capital accounts need to integrate geographical information Global scale: International Conventions Markets framing & regulation Simplified accounts Global trade of ecosystem permits, IPES Programmes assessment (e.g. REDD+) International financial standards (for loans…) Country contribution to international organisations National & regional government: Environmental agencies, Ministries of economy, Statistical offices, Courts SEEA 2013 Framework Beyond GDP Accounting Sector accounts Green taxes Clearing housemechanisms on [1] ES prices & [2] ecosystem mitigation costs Action level: Local scale, management, Site level, case studies, Projects, Business Accounting guidelines, norms, geographical data Impacts assessments, costs & benefits Local government, Agencies assessment Corporate accounting results, rating, trade Markets of specific ecosystem services, PES 4.10=3.28 Jean-Louis Weber, 27 February 2012
The narrative behind Ecosystem Capital Accounts:f. Estimation of ecosystem capital depreciation can be derived from physical degradation t1 t2 j j t2 - t1 j Degradation of ecosystem capital (-) j j Assessment of remediation costs by issues € € Estimation of ecosystem capital depreciation… & addition …based on remediation costs € …based on assets values 4.8=3.25 j Assets j Physical accounts of E-services Account of pressures responsible of degradation Physical accounts of E-services Calculation of unit costs Flows Valuation of E-services Valuation of E-services € NPV & addition NPV & addition € € (-) Assets € € t2 - t1 Jean-Louis Weber, 27 February 2012
4.5 Assets depletion: change in assets Net Present Valuevs. User Cost • Assets depletion is, according to the dominant economic theory equal to the Net Present Value of the future benefits expected from the operation of this asset (net of operation costs). Inconveniences: • Valid only in conditions of pure and perfect market, which doesn’t exist • Natural resource prices (e.g. oil) are very volatile, so depletion calculated from NPV is very unstable • The result depends on the choice of a discounting rate; no standard rule. • Not all assets can be valued with the same parameters… additivity issues • El Serafy (1993, 1996) has proposed that the user cost of natural resource depletion be used to adjust GDP. User cost is that portion of the receipts from selling a nonrenewable resource, net of extraction costs, which must be reinvested in other assets in order to maintain a flow of future income after the resource stock has been completely depleted. El Serafy demonstrates that user cost as a fraction of net receipts equals 1/(1+r)n+1, where r is the interest rate for investment purposes and n the remaining life of the resource stock at the current extraction rate. In general, this leads to a smaller negative adjustment for resource depletion, since part of the income from sales of natural resources is considered "true“ income, to be included in GDP. However, El Serafy's method also greatly reduces the positive adjustments to GDP resulting from discoveries of new resources. • In the WRI study of Indonesia, domestic output adjusted for resource depletion exceeded official GDP in 1974 by 35.7 percent because of significant discoveries of new oil reserves (Repetto et al. 1989:4, 39). • In the user cost method, the discovery of new reserves is not directly included in GDP, but will somewhat reduce the user cost deduction because it extends the expected lifetime n of the reserve and thus reduces the fraction 1/(1+r)n+1. Jean-Louis Weber, 27 February 2012
4.20=2.24 The valuation of environmental assets • The valuation of environmental assets is a complex measurement task. • The SEEA Central Framework adopts the same market price valuation principles as the SNA. • However, since observable market prices are usually not available for environmental assets, the SEEA Central Framework provides an extensive discussion of the techniques that may be applied in the valuation of these assets. • This is particularly the case in relation to the description of the net present value approach (NPV) to valuation and in the discussion of discount rates. Jean-Louis Weber, 27 February 2012
4.6 “User cost” calculation of economic natural assets depletion The formula had as requirements only few variables: (a) an estimate of the size of reserves in physical units; (b) the current year’s extraction, also reckoned in physical units; and (c) an interest rate, indicated by the market, which would point to the income that can be earned by the extracting agent if he or she invested part of the revenue in other assets in order to generate future income. From (a) and (b) the life expectancy of the reserves may be estimated, thus indicating the durability (or sustainability) of the resource if current practices are to continue (i.e. if the current rate of extraction were not changed). Life expectancy (n) at the current extraction rate (before total extinction) is a simple and eloquent indicator of sustainability. The formula, showed how much of the revenue (R) from extraction in any one year can be estimated as ‘true income’ (X), that may be available for consumption, while the rest, to be viewed as a capital element, (R - X) needs to be put aside and reinvested at interest rate (r) to sustain future income at the same level as the estimated income (X) of the current year, viz: Source: Salah El Serafy, 2002 - The “El Serafy” Method for Estimating Income from Extraction and its importance for Economic Analysis Jean-Louis Weber, 27 February 2012
4.12 Conventional valuation of resource depletion is not appropriate for ecosystem degradation • Conventional economic theory: • asset depreciation = • difference between asset values at two dates • cumulated loss of future benefits (financial approach, “Net Present Value”) • NB: 1. and 2. are assumed to be equivalent under the condition of “perfect market” Financial value of natural assets = “Net Present Value” of expected future benefits =NPV Jean-Louis Weber, 27 February 2012
4.13 Final Consumption at the full cost Remediation cost Ecosystem capital accounting: asset = “quantity*quality” (physical measurement) only change is priced (imputed remediation costs) Degradation Restoration + = Purchaser price Jean-Louis Weber, 27 February 2012
4.11 Concepts of Capital Maintenance and the Determination of Profit “104. The concepts of capital in paragraph 102 give rise to the following concepts of capital maintenance: • (a) Financial capital maintenance. (...) • (b) Physical capital maintenance. Under this concept a profit is earned only if the physical productive capacity (or operating capability) of the enterprise (or the resources or funds needed to achieve that capacity) at the end of the period exceeds the physical productive capacity at the beginning of the period, after excluding any distributions to, and contributions from, owners during the period.” Jean-Louis Weber, 27 February 2012
4.16 GDP of the Poor: rationale (TEEB D1) Adapted from Haripriya Gundimeda, Pavan Sukhdev et al., TEEB D1 • Many ecosystem services benefiting the rural poor are accounted for little or for nothing in GDP: • Side products of forestry (fuel wood, non timber forest products [NTFP]), non commercial fisheries • Functional ecosystem services: water quality and regulation, soil fertility, fish stocks regulation • Aesthetic & cultural elements of quality of life, attraction for tourism • However, in case of ecosystem degradation and loss of services, a loss of 1 dollar would hurt poor people more than 1 dollar to the rich: • The marginal utility of 1 dollar is high for the poor – so is the disutility of losing 1 dollar • The poor have little possibilities of replacing free ecosystem services with commercial services • with current accounting rules, such welfare losses of the poor will simply not be recorded in the GDP Jean-Louis Weber, 27 February 2012
4.17 GDP of the Poor, first estimations (TEEB D1) Source: THE ECONOMICS OF ECOSYSTEMS AND BIODIVERSITY TEEB D1 for National and International Policy Makers (Coordinator: Patrick ten Brink), 2009 Chapter 3: Strengthening indicators and accounting systems for natural capital 3.5 Building a fuller picture: the need for ‘GDP of the Poor’ Haripriya Gundimeda, Pavan Sukhdev et al. http://www.teebweb.org/LinkClick.aspx?fileticket=J3_lcRRutGw%3d&tabid=1019&language=en-US Jean-Louis Weber, 27 February 2012
Thank you! Jean-Louis Weber SpecialAdviser on EconomicEnvironmentalAccounting EuropeanEnvironmentAgency jean-louis.weber@eea.europa.eu jlweber45@gmail.com