Download
1 / 34
350 likes | 502 Views
Using GIS to visualize, analyze and forecast seismic hazards. Serkan Bozkurt. -0.6. 0.0 bars. 0.6. animation. animation. animation. animation. 1992 M=7.3 Landers shock increases stress at Big Bear. Landers. Big Bear. Los Angeles. First 3 hr of Landers

E N D
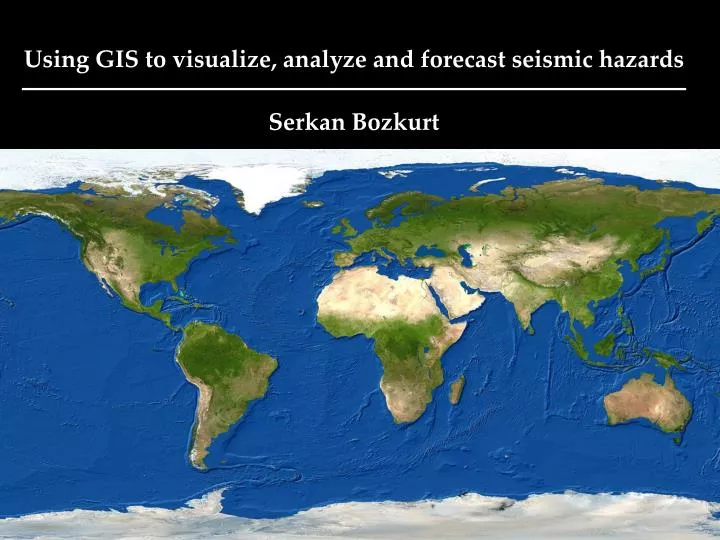
Using GIS to visualize, analyze and forecast seismic hazards Serkan Bozkurt
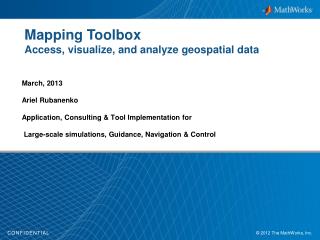
-0.6 0.0 bars 0.6 animation
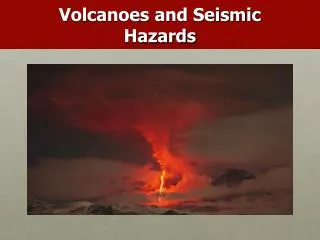
1992 M=7.3 Landers shock increases stress at Big Bear Landers Big Bear Los Angeles First 3 hr of Landers aftershocks plotted
1992 M=7.3 Landers shock promotes the M=6.5 Big Bear shock 3 hr later Landers Big Bear Los Angeles First 3 hr of Landers aftershocks plotted
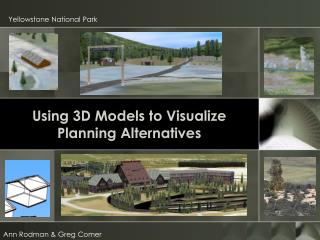
…and promotes the M=7.1 Hector Mine shock 7 yr later Hector Mine Los Angeles First 7 yr of aftershocks plotted
Earthquake Probability Investigation of Greater Tokyo New ways to forecast seismic shaking, and how they stack up in Tokyo Shinji Toda, Masanobu Shishikura, and Kenji Satake Yoshimitsu Okada Takuya Nishimura and Takeshi Sagiya Ross Stein, Serkan Bozkurt, Bill Bakun, Fred Pollitz, Tom Parsons, Marleen Nyst, and Elliot Grunewald Junichi Nakajima and Akira Hasegawa Nobuo Hamada Martin Bertogg, Mariagiovanna Guatteri, Silvio Tschudi, and Atsuhiro Dodo
Fault model from Wald and Somerville
Fault model from M. Matsu’ura et al.
Our model for the 1923 earthquake is based on newly discovered geodetic data Fault slip (cm) Slip direction Tokyo Marleen Nyst Fred Pollitz But the 1703 earthquake was much larger from Nyst et al (2005) and Pollitzet al (2005)
Kanto seismic corridor Historical quakes from Usami (2003) reassessed with powerful computer technique Bill Bakun Elliot Grunewald from Bakun (2005) and Grunewald (in press 2006)
Shinji Toda Ross Stein animation
30-yr earthquake probabilities for greater Tokyo Team Tokyo Study Poisson Renewal M≥7.1 within 50 km of Tokyo 20 >35 (1855 type) M≥7.9 within 100 km of Tokyo (1923 type) 11 0.5 Combined (I≥6 or PGA>0.95 g in Tokyo) 29% >35% 1 2 1 2 from Stein et al. (2006)
data for one cell data for one cell Creating the annual frequency-intensity model
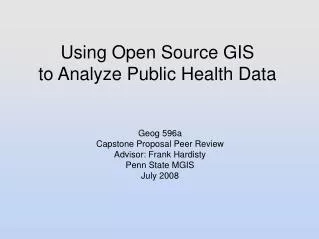
GIS is one of the most powerful toolstovisualize, analyze,and enhance earthscience information. Serkan Bozkurt(USGS, Menlo Park) Residents of Edo appeal to the god Kashima to subdue the catfish, mythical source of the 1855 Ansei-Edo earthquake