Download
1 / 77
790 likes | 1.02k Views
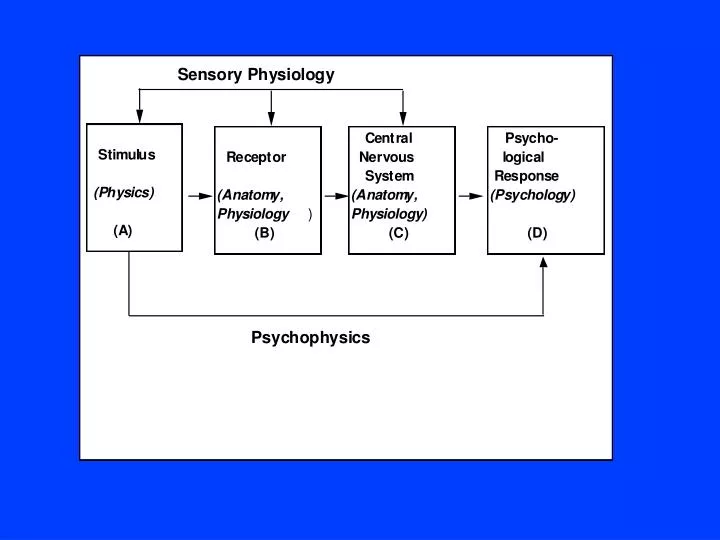
Weber Fractions. Decibel Scale Of Sound Energy. FECHNER’S LAW: = Klog I. STEVEN’S LAW: = K(i) n. Electromagnetic Spectrum. Color Cone. Color Circle. Cross Section Of The Eye. Retinal Cells. Cross Section Of Retina. Path of Light to Rods & Cones. THEORETICAL THRESHOLD FUNCTION.

E N D
Color Cone
Path of Light to Rods & Cones
Stimuli for “Subliminal” Threshold Experiment Word Freq. Value* Word Freq. Value* lotus 10 kotex 1** capon 10 mixer 1 raped 13 terse 4 lathe 11 penis 1** belly 47 hilly 10 noted 45 knack 13 clear 1 filth 4 whore 4 clove 4 tiara 4 bitch 4 Av. Taboo 10.6 Av. Neutral 10.3 *frequency of occurrence in 4 1/2 million words according to the Thorndike-Lorge semantic count. **estimated frequency
Payoff Matrices Signal Signal On Off On Off Response:Yes +1c -10c Yes +25c -1c No -1c +1c No -1c +1c
Frequency Of Signals In Detection Experiment Presentation Presentation rate of .9rate of .2 Signal Signal On Off On Off Response Yes .97 .62 Yes .28 .04 No .03 .38 No .72 .96
Rate of Hits and False Alarms as a Function of the Relative Frequency of Trials on Which Signal was Presented.
Day Vision (cones) Night Vision (rods)
ACUITY CHART
Measuring Visual Acuity
Duplicity TheoryCones: Rods: Number: >7 x 10⁶ >125 x 106Connections with ganglion cells: 1:1 1: manyWavelength of greatest sensitivity: 555 nm 505 nmColor vision: yes noDark adaptation: ~7 min ~40 minSpatial resolution: high lowTemporal resolution: fast slow