Download
1 / 6
70 likes | 441 Views
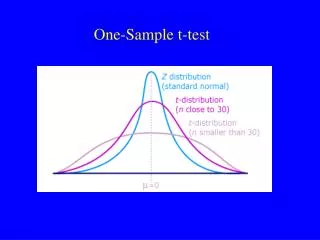
ONE SAMPLE t-TEST FOR THE MEAN OF THE NORMAL DISTRIBUTION. Let sample from N( μ , σ ) , μ and σ unknown , estimate σ using s. Let significance level = α .

E N D
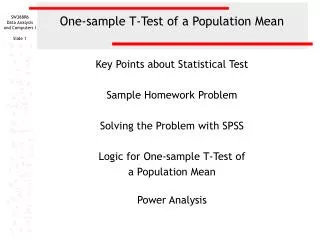
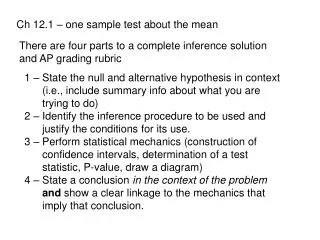
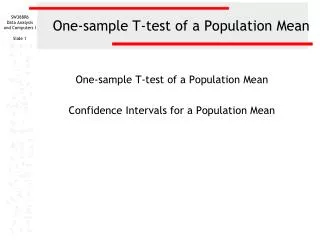
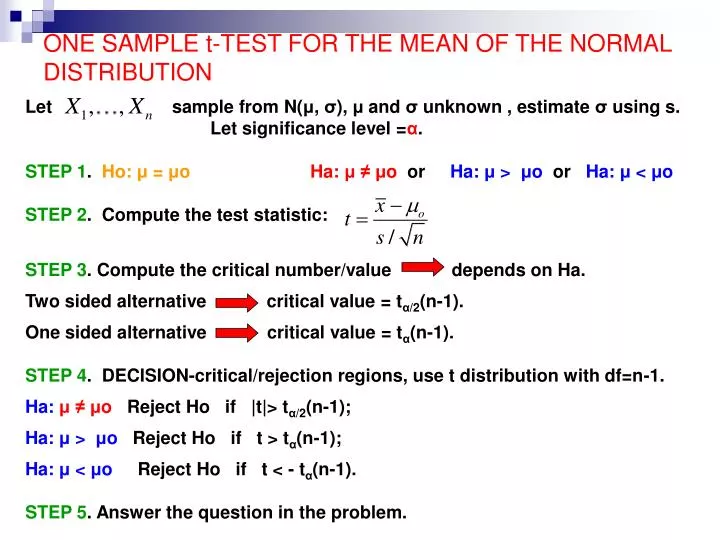
ONE SAMPLE t-TEST FOR THE MEAN OF THE NORMAL DISTRIBUTION Let sample from N(μ, σ), μ andσ unknown , estimate σ using s. Let significance level =α. STEP 1. Ho: μ = μoHa: μ ≠ μo or Ha: μ > μo or Ha: μ < μo STEP 2. Compute the test statistic: STEP 3. Compute the critical number/value depends on Ha. Two sided alternative critical value = tα/2(n-1). One sided alternative critical value = tα(n-1). STEP 4. DECISION-critical/rejection regions, use t distribution with df=n-1. Ha: μ ≠ μo Reject Ho if |t|> tα/2(n-1); Ha: μ > μo Reject Ho if t > tα(n-1); Ha: μ < μo Reject Ho if t < - tα(n-1). STEP 5. Answer the question in the problem.
P-value approach STEP 3. Compute the p-value. Two sided test p-value: Ha: μ ≠ μo, P-value: 2P( t(n-1)> |t|) One sided tests p-values: Ha: μ > μo, P-value: P( t(n-1) > t) Ha: μ < μo, P-value: P( t(n-1) < t) value of a value of the t-random variable test statistic STEP 4. DECISION Reject Ho if p-value < significance level α. STEP 5. Answer the question in the problem.
EXAMPLES Example1. A sample of 36 women resulted in mean height of 64” and sample variance = 25. Are women, on average, shorter than 66”? Use 5% significance level. Assume heights follow normal distribution. Solution. n=36, s2=25, μo=66, α = 5%. STEP1. Ho: μ = 66 Ha: μ < 66 STEP 2. Test statistic STEP3. Critical value? Df=n-1=35 and t0.05(35) ≈ 1.69 (Table C). STEP 4. DECISION: t = -2.4 < -t0.05(35) ≈ -1.69 reject Ho. STEP5. On average, women are shorter than 66”.
EXAMPLE 1 contd. P-value approach STEP 3. P-value = STEP 4. DECISION: P-value=0.01 < sign. level = 0.05 reject Ho. STEP5. On average, women are shorter than 66”.
EXAMPLES, contd. Example 2. Suppose a sample of size 16 results in mean of 10 and standard deviation of 3.2. Test Ho: μ = 8 vs. Ha: μ > 8 using α=0.05. Solution. n=16, s=3.2, μo=8, α = 5%. STEP1. Ho: μ = 8 Ha: μ > 8 STEP 2. Test statistic STEP3. Critical value? Df=n-1=15 and t0.05(15) ≈ 1.753 (Table C). STEP 4. DECISION: t = 2.5 > t0.05(15)=1.753, so we reject Ho. STEP5. Reject Ho.
EXAMPLES, contd. Example 3. Suppose a sample of size 16 results in mean of 10 and standard deviation of 3.2. Test Ho: μ = 8 vs. Ha: μ ≠ 8 using α=0.05. Solution. n=16, s=3.2, μo=8, α = 5%. STEP1. Ho: μ = 8 Ha: μ ≠ 8 STEP 2. Test statistic = 2.5. STEP3. Critical value? Df=n-1=15, α/2=0.025, and t0.025(15) =2.131. STEP 4. DECISION: t = 2.5 > t0.025(15)=2.131, so we reject Ho. STEP5. Reject Ho.