Download
1 / 1
10 likes | 108 Views
RETROSPECTIVE FORECAST EXPERIMENTS WITH THE CFS: Impact of Ocean Initial Conditions Assimilating Satellite Altimeter Data Sudhir Nadiga and David Behringer NCEP/NOAA, Camp Springs, MD-20746. P-1.15 Tuesday. October 23, 2007. Motivation

E N D
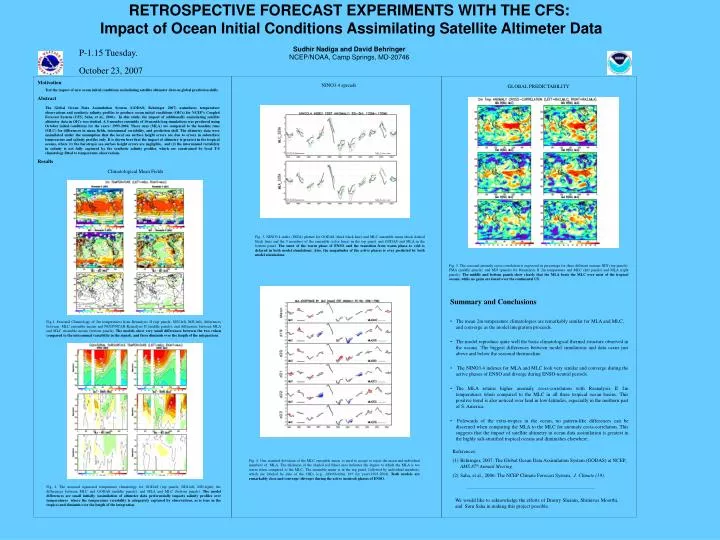
RETROSPECTIVE FORECAST EXPERIMENTS WITH THE CFS: Impact of Ocean Initial Conditions Assimilating Satellite Altimeter DataSudhir Nadiga and David BehringerNCEP/NOAA, Camp Springs, MD-20746 P-1.15 Tuesday. October 23, 2007 Motivation Test the impact of new ocean initial conditions assimilating satellite altimeter data on global prediction skills. Abstract The Global Ocean Data Assimilation System (GODAS; Behringer 2007) assimilates temperature observations and synthetic salinity profiles to produce ocean initial conditions (OICs) for NCEP’s Coupled Forecast System (CFS; Saha, et al., 2006). In this study, the impact of additionally assimilating satellite altimeter data in OICs was studied. A 5-member ensemble of 10-month long simulations was produced using October initial conditions for the years: 1993-2004. These runs (MLA) are compared to the baseline runs (MLC) for differences in mean fields, interannual variability, and prediction skill. The altimetry data were assimilated under the assumption that the local sea surface height errors are due to errors in subsurface temperature and salinity profiles only. It is shown here that the impact of altimetry is greatest in the tropical oceans, where (1) the barotropic sea surface height errors are negligible, and (2) the interannual variability in salinity is not fully captured by the synthetic salinity profiles, which are constrained by local T-S climatology fitted to temperature observations. Results NINO3.4 spreads GLOBAL PREDICTABILITY Climatological Mean Fields Fig. 3. NINO3.4 index (SSTA) plotted for GODAS (thick black line) and MLC ensemble mean (thick dashed black line) and the 5 members of the ensemble (color lines) in the top panel, and GODAS and MLA in the bottom panel. The onset of the warm phase of ENSO and the transition from warm phase to cold is delayed in both model simulations. Also, the magnitudes of the active phases is over predicted by both model simulations. Fig. 5. The seasonal anomaly cross-correlation is expressed in percentage for three different seasons NDJ (top panels), FMA (middle panels), and MJJ (panels) for Reanalysis II 2m temperature and MLC (left panels) and MLA (right panels). The middle and bottom panels show clearly that the MLA beats the MLC over most of the tropical oceans, while no gains are found over the continental US. Summary and Conclusions • The mean 2m temperature climatologies are remarkably similar for MLA and MLC, and converge as the model integration proceeds. • The model reproduce quite well the basic climatological thermal structure observed in the oceans. The biggest differences between model simulations and data occur just above and below the seasonal thermocline. • The NINO3.4 indexes for MLA and MLC look very similar and converge during the active phases of ENSO and diverge during ENSO-neutral periods. • The MLA retains higher anomaly cross-correlation with Reanalysis II 2m temperatures when compared to the MLC in all three tropical ocean basins. This positive trend is also noticed over land in low-latitudes, especially in the northern part of S. America. • Polewards of the extra-tropics in the ocean, no pattern-like differences can be discerned when comparing the MLA to the MLC for anomaly cross-correlation. This suggests that the impact of satellite altimetry in ocean data assimilation is greatest in the highly salt-stratified tropical oceans and diminishes elsewhere. Fig.1: Seasonal Climatology of 2m temperatures from Reanalysis II (top panels; NDJ-left, MJJ-left), differences between MLC ensemble means and NCEP/NCAR Reanalysis II (middle panels), and differences between MLA and MLC ensemble means (bottom panels). The models show very small differences between the two (when compared to the interannual variability in the signal), and these diminish over the length of the integrations. • References: • Behringer, 2007: The Global Ocean Data Assimilation System (GODAS) at NCEP, AMS 87th Annual Meeting. • Saha, et al., 2006: The NCEP Climate Forecast System, J. Climate (19). Fig. 4. One standard deviation of the MLC ensemble mean is used to accept or reject the mean and individual members of MLA. The thickness of the shaded red (blue) area indicates the degree to which the MLA is too warm when compared to the MLC. The ensemble mean is in the top panel, followed by individual members, which are labeled by date of the OICs (e.g., d19=October 19th for years:1993-2004). Both models are remarkably close and converge (diverge) during the active (neutral) phases of ENSO. Fig. 2. The seasonal equatorial temperature climatology for GODAS (top panels; NDJ-left, MJJ-right), the differences between MLC and GODAS (middle panels), and MLA and MLC (bottom panels). The model differences are small initially (assimilation of altimeter data preferentially impacts salinity profiles over temperatures where the temperature variability is adequately captured by observations, as is true in the tropics) and diminish over the length of the integration. We would like to acknowledge the efforts of Dmitry Sheinin, Shrinivas Moorthi, and Suru Saha in making this project possible.