Download
1 / 31
330 likes | 508 Views
Multi-waveband Behavior of Blazars. Alan Marscher Institute for Astrophysical Research, Boston University Research Web Page: www.bu.edu/blazars. Disclaimer.

E N D
Multi-waveband Behavior of Blazars Alan Marscher Institute for Astrophysical Research, Boston University Research Web Page: www.bu.edu/blazars
Disclaimer The data and discussion presented here are but a small subset of the huge number of both wonderful and not-so-wonderful multi-waveband studies. Topics are selected to minimize overlap with other talks & posters at this meeting The author apologizes to the many people whose wonderful studies are not mentioned here, and to those whose data are shown but to whom proper credit is not given. The author is not to be held legally liable for any representations, misrepresentations, omissions, or emissions during this presentation.
The Great Hope of Multi-waveband Variability Studies Use details of variations & SEDs to probe structure & physics of jets close to the central engine (cf. our working model) - Injection, acceleration, collimation of jet • Energization of relativistic particles • Dynamics of flow (shocks, stability, etc.) • Which frequencies participate in flares? • Cross-frequency correlations • Cross-frequency time delays/simultaneity Model of a Blazar 3C 454.3, from Jorstad et al. (ApJ, submitted)
Fermi Light Curves: γ-ray Flux for Every Blazar Every 3 Hours
Example of Complexity:3C 279 (Hayashida et al. 2012, ApJ) Correlations: - Complex or very weak - Time delays vary SEDs: - Double hump (synchrotron, IC) - Gamma-ray flux can be ~ 2 orders of magnitude higher than X-ray Top: Gamma-optical DCF, <0 means gamma leads Bottom: gamma/X-ray DCF
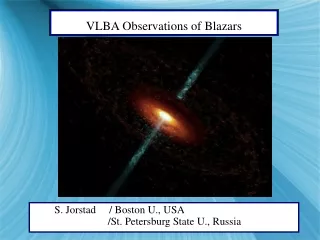
More Comprehensive Approach: Add VLBI Imaging • We can use sequences of VLBA images to relate multi-waveband variations with physical structures in the jet • Comes with polarization maps to compare with optical pol. • Unfortunately, the NSF plans to “divest” the VLBA after this year, i.e., close it down & dismantle the antennas, unless non-NSF funds can be found for its operations (~ $5M/year) • Also, Fermi is under serious financial stress, with a large cut in operations & guest investigator funds next year • NASA has already shut down RXTE & U. Michigan has shut down UMRAO while they were still working well • We need to make an even stronger case for jet studies!
The VLBA Images Gamma-ray Emitting Region 8 mm outbursts start before gamma-ray flares (Lähteenmäki & Valtaoja 2003, León-Tavares et al. 2011) Events in VLBI core at 43 GHz occur before/during gamma-ray flares (Jorstad et al. 2001)
3C 454.3: All wavebands down to mm-wave peaked within 1 day during flare in VLBI core VLBA images at 7 mm wavelength Knot ejected in late 2009, vapp = 10c RJD=5502, 1 Nov 2010; core: 10.3 Jy X-ray RJD=5507, 6 Nov 2010; core: 14.1 Jy R-band RJD=5513, 12 Nov 2010; core: 14.2 Jy 230 GHz Nov. 20, 2010 RJD=5535, 4 Dec 2010; core: 17.7 Jy Wehrle et al. (2012 ApJ)
Behavior of Jet during γ-ray Flares in 34 Blazars over 4 Years Blue: γ-ray fluxRed: mm-wave “core” flux Yellow shading: new superluminal knot “ejected” • Of 62 γ-ray flares, 48 (77%) are simultaneous (within uncertainties) with a new superluminal knot or a major outburst in the core at 7 mm • (Both jet + gamma-ray emission are quiescent over 4 years in 5 sources & 86% of all sources have contemporaneous γ-ray & mm-wave quiescent periods) • Even accounting for chance coincidences, > 50% of γ-ray flares occur in the “core” seen in 7 mm images, parsecs from the black hole γ-ray light curves (blue), “core” light curve at 7 mm (red), & times of new superluminal knots (yellow) for 30 of the blazars in the sample Marscher et al. 2012, Fermi & Jansky proc.
Location of Flares • Fermi + VLBA results: gamma-ray flares occur mostly on parsec scales, in mm-wave core or downstream • So do most optical flares, since gamma-ray/optical correlation is generally strong with ~ zero time delay • - Emission site outside BLR allows 10-500 GeV photons observed in some blazars to escape without pair producing off broad-line photons (e.g., 1222+216: Aleksic et al. 2011; PKS1424-418: Tavecchio et al. 2013) • Are HBLs & IBLs like Mkn421, whose pc-scales jets are usually rather quiet, exceptions? See talks by J. Richards, R. Lico, & K. Niinuma later in the week • Do any flares in quasars or LBLs occur between core & central engine?
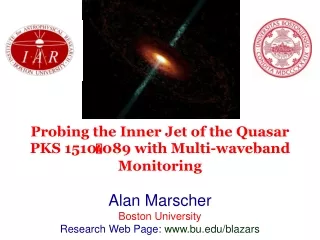
PKS 1510-089 Two episodes of multi-flare outbursts Nalewajko et al. (2012, ApJ): different location for different flares within each episode Interesting note: emission at 14. 5 GHz already participates in outburst during first main gamma-ray flare Both episodes included rotations of optical polarization vector
Quasar PKS 1510-089: first 140 days of 2009 High gamma-ray to synchrotron luminosity ratio: knot passes local source (or variable source) of seed photons that get scattered to gamma-ray energies? -ray Lower ratio: gamma-rays could come mainly from inverse Compton scattering of synchrotron photons produced in same region of jet optical Optical pol. rotation by 720o Superluminal knot passes “core” Marscher et al. (2010, Astrophysical Journal Letters, 710, L126) 2009.0 2009.4
Sites of -ray Flares in PKS 1510-089 (Marscher et al. 2010 ApJL) Mach disk Possible local sources of beamed seed photons: sheath, Mach disk, stray emission-line cloud
Emission feature following spiral path down jet BL Lac: Sketch Feature (slow magnetosonic shock?) covers much of jet cross-section, but not all Centroid is off-center Net B rotates as feature moves down jet, P perpendicular to B 1 3 Bnet P vector 2 4
Rotations of Polarization Vector Are Common Can be helical magnetic field, twisted jet*, or random walk of turbulence 3C 454.3 Jorstad et al. 2013, ApJ, subm. 0716+714 Larionov et al. 2013, ApJ *Raiteri et al. (2011) & Larionov et al. (2013) relate bent trajectory of twisted jet to flux variations in different blazars 3C 279 Kiehlmann et al., in prep
Repeated pattern in 3C 454.3 (Jorstad et al., ApJ, submitted) Seems to be related to physical structures in the jet, within and near the mm-wave “core”, whose “super-resolved” 43 GHz images contain a triple structure (Jorstad et al. 2010, ApJ) As we build a longer data train with Fermi & other time-domain telescopes, we can look for other repeated patterns that reveal physical structure of the jet
Spectral Energy Distributions (SEDs) • All authors of observational papers on multi-waveband variability hire a theorist to produce a model SED, usually single or 2 zones, to compare with data, usually single or 2-3 epochs • Pretty useless unless a model can’t reproduce the SED • Note in SED to left that Lγ ~ 100 Lx • Very challenging for an SSC model • But usual conclusion is that outburst occurs inside BLR, not supported by observations • Thermal seed photons from torus or stray cloud near jet? PKS 1510-089 (Vercellone et al. 2010, ApJ)
SED of an HBL/TeV Emitter Consistent with synchrotron emission extending through X-rays, SSC in gamma-rays Higher level of variability in these spectral regions than at radio frequencies Mkn 421 (Giebels et al. 2007, A&A)
Intimate Relationship between X-ray and TeV Emission - Radio-intermediate BL Lac objectsMkn421 light curves (Acciari et al. 2011 ApJ, 738, 25)Typical TeV-emitting BL Lac objectX-ray emission consistent with synchrotron radiation by ~TeV electronsUsually – but not always – TeV variations are essentially simultaneous with X-ray variations
Break in Synchrotron Spectrum SED can be roughly described by broken power law • break often by more or less than 1/2 expected from radiative losses Volume filling factor decreases at higher electron energies/higher frequencies
Problem: Intra-day Variability on Parsec Scales hν > 0.2 TeV • Changes in flux are observed to occur on time-scales tvar as short as minutes • How can this occur parsecs from the black hole? • Size of region needs to smaller than ctvar [δ/(1+z)] ~ 2x10¹⁴tvar,hr δ cm, • where z is the redshift of the host galaxy and δ is the Doppler factor (blueshift) from relativistic motion of plasma • Superluminal motion implies δ ~ 20 - 50 • + Jet is very narrow (~ 0.1/Γflow ; Jorstad et al. 2005, Clausen-Brown et al. 2013) so jet width 1 pc from black hole ~ 1017 cm • + Only some fraction of jet x-section is bright at any given time • Magnetic reconnection jet-in-jet model (Giannios 2013, MNRAS), or turbulence(Narayan & Piran 2012, MNRAS; Marscher 2012, Fermi and Jansky proc.) BL Lacertae Arlen et al. (2013) 1 hour Quasar PKS 1510-089 (Foschini et al. 2013): 20-minute doubling time
The Case for Turbulence as a Major Factor in Blazar Jets Possible source of turbulence: current-driven instabilities at end of acceleration/collimation zone (e.g., Nalewajko & Begelman 2012, MNRAS)
Blazars: Power-law PSDs Noise process X-ray - Rapidly changing brightness across the electromagnetic spectrum • Power spectrum of flux changes follows a power law random fluctuations dominate Chatterjee et al. 2008 ApJ
Blazar BL Lacertae in 2011 γ-rays become bright as new superluminal knots pass through “core” & through other stationary emission features on the VLBA image Degree of linear polarization & variations in degree & position angle suggest turbulence at work Optical polarization Approx. location of black hole
Polarization Decreases with Wavelength 3C 454.3 during brightest state (Jorstad et al. 2013) - Expected if fewer turbulent cells are involved in emission at shorter wavelengths
Turbulent Extreme Multi-zone (TEMZ) Model (Marscher 2012) Many turbulent cells across jet cross-section, each followed after crossing shock, where e-s are energized; seed photons from dusty torus & Mach disk Each cell has random B direction; B & number of e-s vary according to PSD Important feature: only small fraction of cells can accelerate electrons up to energies high enough to produce optical & γ-ray emission More rapid variability to explain intra-day flux changes Mach disk (optional) Conical standing shock Looking at the jet from the side
Sample Simulated Light Curve Similar to BL Lac orphan flares • Outbursts & quiescent periods arise from variations in injected energy density • Random with probability distribution determined by red-noise power spectrum Polarization is stronger at higher frequencies Position angle fluctuates, occasionally rotates at random times, but is usually within 20° of jet direction (as observed in BL Lac)
Sketch of a Quasar-Blazar Components as indicated by theory & observations of SED, variability & polarization Flares from moving shocks and denser-than-average plasma flowing across standing shock
Conclusions • We are now accumulating an extremely rich data set • Theoretical models need to catch up to observations if they are to succeed in reproducing all of the characteristics of blazar emission • Most outbursts & flares occur on parsec scales • source(s) of seed photons for gamma-ray emission remains a difficult problem • Emission-line clouds lying along jet (León-Tavares et al. 2012, ApJ; Isler et al. 2013, in prep.; revival of Ghisellini & Madau 1996 idea)? • We need to find a way to keep our best time-domain instruments operating!!
Rotation of Optical Polarization in PKS 1510-089 Rotations of optical (+ sometimes radio) polarization are common, especially during outbursts Flux Polarization Optical In 1510-089 rotation starts when major optical activity begins, ends when major optical activity ends & superluminal blob passes through core Direction of optical polarization Model curve: blob following a spiral path through toroidal magnetic field in an accelerating flow increases from 8 to 24, from 15 to 38 Blob moves 0.3 pc/day as it nears core Core lies > 17 pc from central engine Time when blob passes through core 2009.0 2009.5
Turbulence (or reconnection) Solution to Time-scales (see also Narayan & Piran 2012) • Need to understand that opening angle of jet is very narrow: ~ 0.1/Γflow (Jorstad et al. 2005; Clausen-Brown et al. 2013) Half-width of jet at core ~ 0.1 d(core,pc) Γflow-1 pc • If filling factor f of cells with electrons of high enough energy to emit at at optical/gamma-ray frequencies is low or blob doesn’t cover entire jet cross-section, time-scale of variability can be very short: tvar ~ 120 f1/2 (1+z) (Γflow δflow δturb)-1d(core,pc) days For f ~ 0.1, z ~ 0.5, Γflow ~ δflow ~ 30, δturb ~ 2, d(core) ~ 10 pc, tvar ~ 0.3 days Minutes for smaller, less distant blazars like TeV BL Lac objects