Download
1 / 13
130 likes | 136 Views
The information and views in this report, our website & all the service we provide are believed to be relia-ble, but we do not accept any responsibility (or liability) for errors of fact or opinion. Users have the right to choose the product/s that suits them the most. Sincere efforts<br>have been made to present the right investment perspective. The information contained herein is based on analysis and up on sources that we consider reliable. This material is for personal information and based upon it & takes no responsibility. The information given herein should be treated as only factor, while making investment decision. The re-port does not provide individually tailor-made investment<br>advice. 24 Carat Financial services recommends that investors independently evaluate particular investments and strategies, and encourages investors to seek the advice of a financial adviser.

E N D
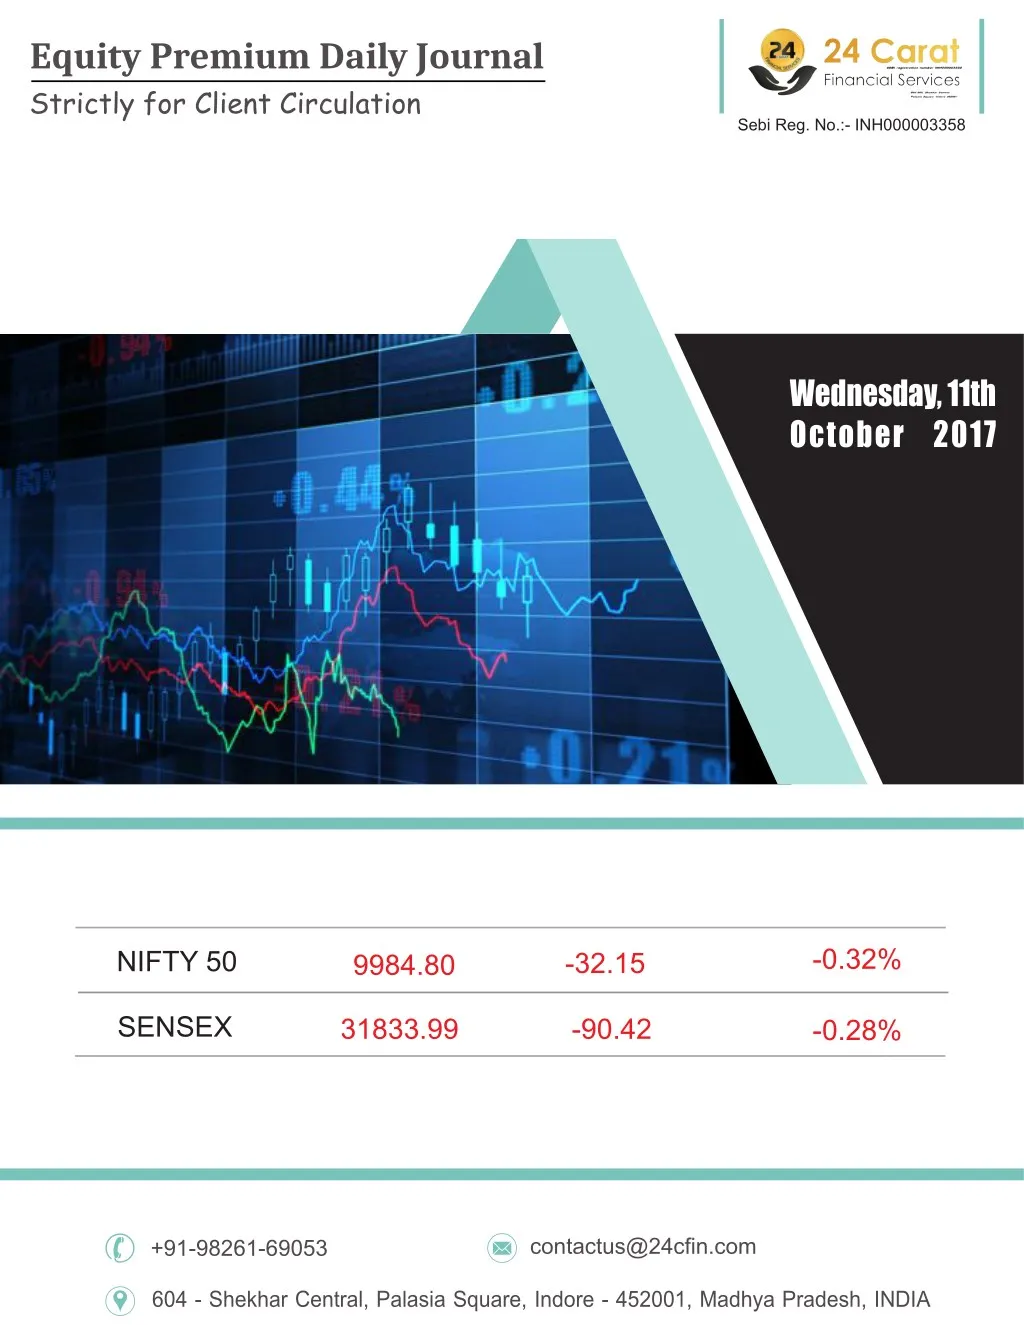
Equity Premium Daily Journal Strictly for Client Circulation Sebi Reg. No.:- INH000003358 Wednesday, 11th October 2017 -0.32% NIFTY 50 -32.15 9984.80 SENSEX 31833.99 -90.42 -0.28% contactus@24cfin.com +91-98261-69053 604 - Shekhar Central, Palasia Square, Indore - 452001, Madhya Pradesh, INDIA
Market Wrap Wednesday, 11th October 2017 Nifty snap 3-day winning streak amid geopolitical tension The Indian equity markets have erased all its early gains and have slipped in the red a?er reports stated that media reports stated that US warship entered Chinese waters. There were also reports that President Donald Trump discussed a "range of op?ons" with top military advisors to reply to North Korea's hos?lity and avert it from in?mida?ng the US. Bank Ni?y led the decline, as it fell over 1%. PSU banking stocks were the top laggards led by SBI and Bank of Baroda. Even private bank majors like ICICI Bank, HDFC Bank and Kotak bank ended with losses. HDFC Bank, Reliance Industries, ITC and Infy were the top contributors to the fall in the Ni?y. Barring the IT index all the other sectoral indices ended in the red. Following were the top gainers in the IT index. Symbol NIFTY IT TCS WIPRO HCLTECH 910 % Chng 0.6 1.7 1.4 1.2 LTP 10,785 2,500 291 Immediate support for Ni?y is seen around the 9940 mark which is the 21-DMA. Buzzing Stocks ü Closing Bell: Gainers: Airtel (+5.5%), HPCL (+4%), Infratel (+3%). Losers: Yes Bank (-3%), SBI, Vedanta (-2%). ü BSE Telecom Index up 3%. Airtel (+5%), Infratel (+3%). ü Ni?y PSU Bank Index slips over 2%. Andhra Bank, Syndicate Bank (-5%), Union Bank, PNB (-4%), SBI, BoB (-2%). ü Lakshmi Vilas Bank Q2 FY18 (YoY): PAT at Rs 10.5 Cr vs Rs 65 Cr (-84%). NII at Rs 233 Cr vs Rs 187 Cr (+25%). ü SREI Infra stock gains 2% on joint venture with CBL Corp to offer surety & guarantee products. ü Sical Logis?cs stock jumps 4% on proposal to acquire stake in subsidiary company. ü Goa Carbon stock shines 3% a?er Q2 FY18 numbers. ü Infratel stock gains 3% on report KKR-led consor?um may buy company. +91-98261-69053 www.24cfin.com
Market Action Wednesday, 11th October 2017 4:17 PM Telecom & Energy stocks move up Shares of Telecom and Energy Companies have made gains; Gainers: Airtel(+4.93%) HPCL(+4.23%) IOCL(+1.76%). 4:15 PM Indian markets snap off their gaining streak Indian markets have snapped of their 3-day gaining streak; Nifty at 9984 , moves down by 32 pts. 12:46 PM European markets make a slow start European markets make a slow start; No major movement seen in DAX & CAC. Indian markets continue to make steady gains; Nifty at 10058 (+41 pts). 10:43 AM Coal India signs a salary agreement Shares of Coal India have dropped by ~1% after the Company signed a wage agreement with workers' unions. 10:34 AM PSP projects wins new orders Shares of PSP Projects have gone up by ~6%, after the Company bagged orders worth Rs 1,575 crore from Surat Diamond bourses. 10:32 AM Axis Bank gains on ratings upgrade Shares of Axis Bank have extended gains for the fourth day; risen by ~1.35% after the Bank got a rating upgrade. 10:27 AM Realty & Metal stocks gain Realty & Metal stocks move up, Tech stocks drop. GAIL (+2.56%) Bharti Infratel (+1.44%) Axis Bank (+1.31%). 10:26 AM Indian markets off to a strong start Shares of Indian markets have moved up; Nifty at 10054, gains 38 points. +91-98261-69053 www.24cfin.com
Key Indices Wednesday, 11th October 2017 Today Index Nifty 50 Bank Nifty Nifty Next 50 Nifty 100 Nifty 200 Nifty 500 Nifty Midcap 100 Nifty Smallcap 100 % Change -32.15 (-0.32%) -240.00 (-0.99%) -176.75 (-0.62%) -38.10 (-0.37%) -24.90 (-0.46%) -44.00 (-0.50%) -198.30 (-1.06%) -110.70 (-1.39%) LTP High Low 9,984.80 24,107.45 28,214.85 10,353.90 5,425.55 8,792.40 18,480.35 7,847.65 10,067.25 24,460.25 28,606.45 10,447.15 5,480.15 8,886.80 18,809.75 8,010.45 9,955.80 24,054.25 28,051.05 10,319.45 5,406.35 8,760.65 18,385.60 7,796.90 Advance/ Decline Index Nifty 50 Nifty Next 50 Nifty 100 Nifty 200 Nifty 500 Advance 15 14 29 49 143 Decline 35 36 72 152 356 Sector Indices Today % Change Index LTP High Low Nifty IT Nifty Energy Nifty FMCG Nifty Financial Services Nifty Auto Nifty Pharma Nifty Metal Nifty Media Nifty Realty Nifty PSU Bank 10,785.25 13,389.95 25,187.50 9,958.00 10,960.30 9,441.15 3,668.45 3,004.55 277.05 3,029.65 59.10 (0.55%) 9.75 (0.07%) -17.35 (-0.07%) -61.65 (-0.62%) -69.55 (-0.63%) -89.15 (-0.94%) -53.10 (-1.43%) -58.70 (-1.92%) -5.45 (-1.93%) -74.55 (-2.40%) 10,811.05 13,557.90 25,315.10 10,077.30 11,095.35 9,586.85 3,750.60 3,076.85 285.50 3,126.15 10,720.45 13,349.40 25,078.50 9,935.05 10,912.45 9,385.15 3,637.35 2,979.95 275.45 3,019.40 +91-98261-69053 www.24cfin.com
Index Pullers & Draggers Wednesday, 11th October 2017 Index Draggers Index Pullers Company Name Change Company Name Change LTP Contribution Points LTP Contribution Points 403.55 18.95 (4.93%) 6.19 1,790.15 -6.70 -12.55 (-0.70%) Bharti Airtel HDFC Bank 2,500.35 41.10 (1.67%) 5.23 251.75 -5.12 TCS St Bk of India -5.20 (-2.02%) 455.00 18.45 (4.23%) 3.43 363.00 -4.84 H P C L Yes Bank -9.90 (-2.65%) 1,750.75 6.00 (0.34%) 2.48 1,043.85 -4.13 H D F C Kotak Mah. Bank -11.80 (-1.12%) 418.10 7.25 (1.76%) 1.89 415.50 -4.03 I O C L Tata Motors -8.10 (-1.91%) Stocks Showing Activity Top Losers-Nifty 500 Top Gainers -Nifty 500 Company Name Change Company Name Change LTP LTP 264.00 17.80 (7.23%) 49.35 -5.45 (-9.95%) Century Ply. Religare Enterp. 4.60 (6.12%) -40.10 (-5.84%) 79.75 646.40 IL&FS Transport Guj Alkalies 3.35 (5.59%) -11.55 (-5.73%) 63.25 189.85 MMTC JBF Inds. 13.55 (5.56%) -2.50 (-5.19%) Sterlite Tech. Marksans Pharma 257.45 45.65 9.70 (5.50%) -7.50 (-5.14%) Jindal Stain .Hi Minda Corp 186.00 138.35 +91-98261-69053 www.24cfin.com
52-Week High-Low Wednesday, 11th October 2017 52 Week High Today-Nifty500 52 Week Low Today-Nifty500 Company Name Change Company Name Change LTP LTP 257.45 13.55 (5.56%) 16.30 -0.40 (-2.40%) Sterlite Tech. Rel. Comm. 9.90 (5.13%) 203.05 681.45 -9.10 (-1.32%) Adani Transmissi Amara Raja Batt. 12.20 (4.97%) 257.90 769.70 3.00 (0.39%) Petronet LNG Dr Lal Pathlabs 8.20 (4.40%) Gayatri Projects 194.70 18.90 (3.37%) Finolex Cables 579.65 Global Indices Change -4.31 10.25 -2.96 69.61 13.91 62.98 % Change -0.08 Indices CAC 40 DAX FTSE DOW Jones Shanghai Hang Seng Nasdaq Nikkei Straits Times Date Value Previous Close 5,363.64 12,949.25 7,538.27 22,761.07 3,374.37 28,326.59 6,579.73 20,823.51 3,291.56 11/10/2017 11/10/2017 11/10/2017 10/10/2017 10/10/2017 10/10/2017 10/10/2017 10/10/2017 10/10/2017 5,359.33 12,959.50 7,535.31 22,830.68 3,388.28 28,389.57 6,587.25 20,881.27 3,280.28 0.08 -0.04 0.31 0.41 0.22 0.11 0.28 -0.34 7.52 57.76 -11.28 +91-98261-69053 www.24cfin.com
Nifty Spot View Wednesday, 11th October 2017 NIFTY 9984.80 -32.15 (-0.32%) Oct 11, 16:00 Intraday 52 Week 10,178.95 10,042.60 10,067.25 OPEN HIGH P. CLOSE 10,016.95 9,955.80 7,893.80 LOWS 10115 R2 R1 10050 10002 Pivot 9930 S1 9890 S2 Jus?fica?on & Comments üIn Wednesday's trading session Benchmark Indices Ni?y opened on a gap up note and traded in the posi?ve territory for first half of the market. However, The market wiped out morning gains in last couple of hours of trade and ended lower as investors turned cau?ous ahead of September CPI infla?on and August industrial output data due on Thursday. The cut in India’s growth forecast by World Bank also dampened sen?ment. Ni?y-50 index closed below 10000 levels at 9984.80 level down 32.15. üIn last couple of days, the overall intraday ac?vity in index has shrunk dras?cally; leading to forma?on of ‘Doji’ on daily chart in last two days which were also indica?ng some kind of indecisiveness in the index and today index made a strong bearish candle. Ni?y-50 is taking support from its 21 & 50 days moving averages on daily chart. üFor the coming session, 10030-10070 would be seen as immediate hurdles; whereas, on the lower side, any sustainable move below 9950 would result into some weakness towards 9910-9870 levels. +91-98261-69053 www.24cfin.com
Bankl Nifty Spot View Wednesday, 11th October 2017 NIFTY BANK 24107.45 -240.00 (-0.99%) Oct 11, 16:00 Intraday 52 Week 25,198.80 24,411.45 24,460.25 OPEN HIGH P. CLOSE 24,347.45 24,054.25 17,606.90 LOWS 24610 R2 24360 R1 24210 Pivot 23950 S1 23800 S2 Jus?fica?on & Comments üIn Wednesday’s trading session Bank Ni?y opened on a gap up note and traded with posi?ve movement for first half of the market but in second half strong selling was seen in Index. Bank Ni?y fell over 1% & closed at 24107 level down 240. PSU banking stocks were the top laggards led by SBI and Bank of Baroda. Even private bank majors like ICICI Bank, HDFC Bank and Kotak bank ended with losses. üNi?y Bank index has formed a strong bearish candle on daily chart as index lost its two days gain in just 2 hours of trading indica?ng strong bearish move in index in next session as Bank Ni?y index now trading below its 21 & 50 days moving averages. üThe support for the Ni?y Bank index is now placed around 24000 and 23800 whereas the resistance is seen in the range of 24250-24350. +91-98261-69053 www.24cfin.com
“24 Carat”Call Wednesday, 11th October 2017 Range 507.15 - 524.00 52 week 427.65 - 568.60 Open 523.30 Vol. 3.16M Mkt cap 494.59B P/E 21.93 Zee Entertainment Enterprises Limited (NSE:ZEEL) 515.20 -7.70 (-1.47%) Oct 11 - Close Currency in INR Zee Entertainment Enterprises Limited is a media and entertainment company engaged in providing broadcasting services. The Company operates through Content and Broadcasting segment. It offers content in multiple languages and offers approximately 38 international and over 30 domestic channels. The Company has a library, housing over 222,703 hours of television content. The Company holds rights to approximately 3,820 movie titles. The Company's brands include Zee TV, Zee Cinema, Zee Action, Zee Classic, Zee Anmol, Zee Cafe, Zee Studio, Zee Salaam, Zing, ETC Bollywood, Zee Q and Zindagi. The Company has a range of offering in the regional language domain with channels, such as Zee Marathi, Zee Talkies, Zee Bangla, Zee Bangla Cinema, Zee Telugu, Zee Kannada, Zee Tamil and Sarthak TV. It high definition offerings include Zee TV HD, Zee Cinema HD, &tv HD, Zee Studio HD, Zee Cafe HD, &pictures HD, Ten 1 HD and Ten Golf HD. The Company has operations in over 170 countries. 532 R2 523 R1 515 Pivot 506 S1 498 S2 Jus?fica?on & Comments Zee Entertainment Enterprises Limited Looks bearish on Daily charts (NSE:ZEEL) ü üStock is trading in a Range of 550 on the higher side & 495 on the lower side üIts Heading towards the lower Range of the Trading Range üTrend line Break down has been seen in the Stock (Refer to Chart a?ached) üMomentum Indicator MACD Histogram Trading in Nega?ve zone. üToday Stock breached 50EMA & 100 EMA. Also Managed to Close Below Key Moving Averages üLooking at the Chart Structure, Trend line break down & Moving Averages, Stock looks weak; hence we suggest short selling in the next intraday trading session. SELL ZEEL @ 514.50- 516.50 TARGET 505/ 495 STOP LOSS 525.5 (QTY: 1300) +91-98261-69053 www.24cfin.com
“24 Carat”Call Wednesday, 11th October 2017 Range 250.45 - 258.45 52 week 235.00 - 315.30 Open 257.15 Vol. 14.19M Mkt cap 2.17T P/E 91.59 Bank of India (NSE:BANKINDIA) 251.20 -5.75 (-2.24%) Oct 11 - Close Currency in INR State Bank of India provides a range of products and services to personal, commercial enterprises, large corporates, public bodies and institutional customers. Its segments include Treasury, which includes the entire investment portfolio and trading in foreign exchange contracts and derivative contracts; Corporate/Wholesale Banking, which comprises the lending activities of Corporate Accounts Group, Mid Corporate Accounts Group and Stressed Assets Management Group; Retail Banking, which comprises branches in National Banking Group, which primarily includes Personal Banking activities, including lending activities to corporate customers having banking relations with branches in the National Banking Group, and Other Banking Business, which includes the operations of all the Non-Banking Subsidiaries/Joint Ventures other than SBI Life Insurance Co. Ltd. and SBI General Insurance Co. Ltd. The Company had approximately 22,500 branches and 58,000 ATMs. 143 R2 139 R1 136.50 Pivot 132 S1 129 S2 Jus?fica?on & Comments: Bank of India ü üClosed below immediate support of 137.10 üFurther downside can be seen if stock sustains below 135 üKey Momentum Oscillator MACDH (21, 50) entered nega?ve zone on daily chart üStock firmly trading below Key Moving averages: 21 EMA, 50 EMA & 100 EMA on daily Chart üLooking to the technical Indicators, Moving Averages. We suggest selling in the stock for next intraday trading session looks bearish on Daily charts (NSE:BANKINDIA) SELL BANKINDIA AROUND 136-135.5 TARGETS 133/131 STOP LOSS 138 (QTY: 5000) +91-98261-69053 www.24cfin.com
FII And DII Activity Wednesday, 11th October 2017 Updated till 10th October 2017 FII RS CRORES Net Purchase/ Sales Date Gross Purchase Gross Sales 10-Oct-2017 09-Oct-2017 06-Oct-2017 05-Oct-2017 04-Oct-2017 03-Oct-2017 3518.19 2882.87 3601.52 3201.46 3963.75 5770.20 -504.82 -475.11 -1,040.40 -656.50 -632.14 -693.03 4023.01 3357.98 4641.92 3857.96 4595.89 6463.23 DII RS CRORES Net Purchase/ Sales Date Gross Purchase Gross Sales 3045.65 2585.48 3978.12 2946.00 2814.19 3803.19 2643.50 2530.06 2738.38 2426.97 2229.31 2250.78 2643.50 2530.06 2738.38 2426.97 2229.31 2250.78 402.15 55.42 1,239.74 519.03 584.88 1,552.41 FII And DII Activity Updated till 10th October 2017 Monthly FII Data (RS CRORES) Gross Purchase Net Purchase/ Sales Date Gross Sales September 2017 August 2017 July 2017 95,431.19 95,588.51 104,497.69 119,401.16 111,584.14 103,032.84 -23,969.97 -15,995.63 1,464.85 Monthly DII Data (RS CRORES) Gross Purchase Net Purchase/ Sales Date Gross Sales September 2017 August 2017 July 2017 +91-98261-69053 www.24cfin.com 79,160.50 70,219.04 67,911.76 58,134.97 54,013.82 63,125.39 21,025.53 16,205.22 4,786.37
Diamond Call Performance & Profit Wednesday, 11th October 2017 Our Previous Recommendation Call Date P & L Target/SL +30,000/- NIL -5,400/- +11,200/- +13,000/- +14,000/- +28,000/- NIL NIL NIL -21,000/- +26,250/- 3rd Oct-2017 3rd Oct-2017 4th Oct-2017 4th Oct-2017 5th Oct-2017 5th Oct-2017 6th Oct-2017 6th Oct-2017 9th Oct-2017 9th Oct-2017 10th Oct-2017 11th Oct-2017 BUY PCJWELLERS @ 348.50 - 352.50 TARGET 362.50/ 372.5 SL 340.50 (QTY: 1500) SELL STAR BELOW 845 TARGETS 830/ 810 SL 860 (QTY: 500) SELL APOLLOTYRE BELOW 237.45 TARGET 232.45/ 227.45 SL 242.45 (QTY: 3000) BUY AUROPHARMA AROUND 722- 726 TARGETS 740/ 758 SL 703.95 (QTY: 800) BUY BHARATFIN AROUND 958- 968 TARGET 983/ 997 STOPLOSS 943 (QTY: 1000) SELL STAR AROUND 865- 855 TARGETS 825/ 795 STOP LOSS 885 (QTY: 500) BUY JUSTDAIL @ 402- 404 TARGET 414.5/ 427 STOP LOSS 389.50 (QTY: 1200) BUY RELIANCE AROUND 828- 832 TARGETS 847/ 862 STOP LOSS 818 (QTY: 1000) BUY PVR @ 1370- 1380 TARGET 1420/ 1460 STOP LOSS 1340 (QTY: 400) BUY BATAINDIA AROUND 745- 750 TARGETS 770/ 785 STOP LOSS 730 (QTY: 1100) BUY ASHOKLEY @ 126- 126.5 TARGET 129/ 132 STOP LOSS 123 (QTY: 7000) BUY MOTHERSUMI ABOVE 349.5 TARGETS 353/ 356.5 STOP LOSS 346 (QTY: 3750) TG ACHIEVED NOT EXECUTED CLOSE @239.25 TG ACHIEVED MADE HIGH 981 CLOSED @ 837 TG ACHIEVED CLOSE @ 830 CLOSED @ COST NOT EXECUTED SL TRIGGERED TG ACHIEVED +91-98261-69053 www.24cfin.com
Bulls Eye’s Calls Monthly Performance Checked By:- Months Profit & Loss Rs. 2,76,900/- Rs. 96,050/-* September 2017 October 2017 November 2017 December 2017 Disclaimer 24 CARAT FINANCIAL SERVICES The information and views in this report, our website & all the service we provide are believed to be relia-ble, but we do not accept any responsibility (or liability) for errors of fact or opinion. Users have the right to choose the product/s that suits them the most. Sincere efforts have been made to present the right investment perspective. The information contained herein is based on analysis and up on sources that we consider reliable. This material is for personal information and based upon it & takes no responsibility. The information given herein should be treated as only factor, while making investment decision. The re-port does not provide individually tailor-made investment advice. 24 Carat Financial services recommends that investors independently evaluate particular investments and strategies, and ncourages investors to seek the advice of a financial adviser. 24 Carat Financial Services shall not be responsible for any transaction conducted based on the information given in this report, which is in violation of rules and regulations of NSE and BSE. The share price projections shown are not necessarily indicative of future price performance. The information herein, together with all estimates and forecasts, can change without notice. Analyst or any person related to 24 Carat financial Services might be holding positions in the stocks recommended. It is under-stood that anyone who is browsing through the site has done so at his free will and does not read any views expressed as a recommendation for which either the site or its owners or anyone can be held responsible for. Any surfing and reading of the information is the acceptance of this disclaimer. All Rights Reserved. Investment in equity & bullion market has its own risks. We, however, do not vouch for the accuracy or the completeness thereof. we are not responsible for any loss incurred whatsoever for any financial profits or loss which may arise from the recommendations above 24 Carat Financial Services does not purport to be an invitation or an offer to buy or sell any financial instrument. Our Clients (Paid Or Unpaid), Any third party or anyone else have no rights to forward or share our calls or SMS or Report or Any Information Provided by us to/with anyone which is received directly or indirectly by them. If found so then Serious Legal Actions can be taken. Team : Designation Name Email (Technical Research Analyst-Head) 24cfin.research@gmail.com Mr. Prateek Gupta (Sr. Derivative & Technical Analyst) 24cfin.lakhan@gmail.com Mr. Lakhan Patidar (Commodity Research Analyst) 24cfin.mcx@gmail.com Mr. Dharmendra Saloniya (Trainee Research Analyst) 24cfin.neha@gmail.com Mrs. Neha Baraskar (Sr. Graphic Designer) 24cfin.reports@gmail.com Mr. Shubham Chinwar +91-98261-69053 www.24cfin.com