Download
1 / 61
640 likes | 936 Views
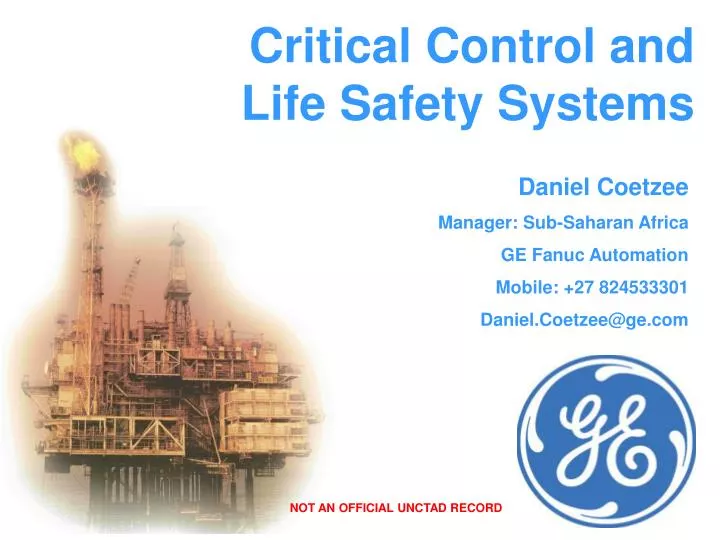
Critical Control and Life Safety Systems. Daniel Coetzee Manager: Sub-Saharan Africa GE Fanuc Automation Mobile: +27 824533301 Daniel.Coetzee@ge.com. NOT AN OFFICIAL UNCTAD RECORD. A most admired and respected company since 1892 Locations in 100 countries and employs 320,000 people

E N D
Critical Control and Life Safety Systems Daniel Coetzee Manager: Sub-Saharan Africa GE Fanuc Automation Mobile: +27 824533301 Daniel.Coetzee@ge.com NOT AN OFFICIAL UNCTAD RECORD
A most admired and respected company since 1892 • Locations in 100 countries and employs 320,000 people • GE 2004 Revenues$160 billion • 2004 R&D Expenditures for GE were $3.5 Billion • If ranked independently, 11 GE businesses would be on Fortune 500 Healthcare Insurance NBC Advanced Materials Commercial Finance Consumer Finance Consumer & Industrial Energy Equipment Services Transportation Infrastructure GE Infrastructure GE Water GE Security GE Sensing GE Fanuc
Agenda Introduction Specifications, Standards and Models Risk and Design Trends GE Product Offerings Conclusion
Safety Systems: What are They? • Dedicated to maintaining a plant at a safe level • Control System and Safety System are independent • The elements of Safety Systems include: • . Emergency shutdown; • . Turbo-machinery control; • . Fire & gas detection; • . Critical process control; • . Burner management.
What is a Critical System? • A critical system is one in which a failure could lead to • Injury or loss of life • Damage to environment • Damage to the plant • Loss of production
The Safety System’s role is to: • Monitor critical parameters in the process • Detect and react to potential hazards • Perform preventative analysis • Alert operators to safety related problems • Reduce production loss and equipment damage • Protect people and the environment • Satisfy laws and regulations • Reduce risk profile
Grim reminders … • Piper Alpha • Bhopal • Seveso • Three Mile Island
Agenda Introduction Specifications, Standards and Models Risk and Design Trends GE Product Offerings Conclusion
Process Safety Management PSM is the set of safety-related operational processes and activities, which results in a specific safety performance of a process installation.
HSE – Causes of Control System Failures • Failures during the full lifetime of control system • 44% of the cause of accidents are due to bad specifications CHANGES AFTER COMMISSIONING 20% OPERATION & MAINTENANCE 15% INSTALLATION & COMMISSIONING 6% DESIGN / IMPLEMENTATION 15% REQUIREMENT SPECIFICATION 44%
TUV, NFPA, OSHA, ISA, etc. Approving Organisations IEC-61508, DIN V 19250, NFPA-85/86, ISA-84.01, etc. Standards, Norms, Specification Guidelines AK1-6, SIL 1-4, etc. The safety level In progress: IEC-61131-X A new standard in development, especially for PES-systems Important • Every Application is different • Each Safety System is therefore different
IEC 61508 (Technical Committee 65, 1984) • adopts a broad range of principles, techniques and measures to achieve functional safety • considers all E/E/PES and software safety lifecycle phases • conceived with rapidly developing technology in mind • uses SIL for specifying the target level of safety integrity • adopts a risk-based approach for determination of SIL • target SRS performance requires proper design, reliable equipment, & competent operators
IEC 61508 Part 1, Overall Safety Lifecycle 1-8 Risk Analysis 9-11 Realisation 12-16 Utilisation
Agenda Introduction Specifications, Standards and Models Risk and Design Trends GE Product Offerings Conclusion
Risk Assessment – The first step Do I need a Safety system? RISK is a function of both frequency and consequence Identify Hazardous and Potentially Hazardous events Assess likely frequency of hazardous events without safety system Is the frequency / consequence of the hazard a tolerable risk ?
What is a tolerable risk ??? ALARP principle - reasonableness is normally demonstrated using a cost versus benefit analysis.
Tolerable Risk and Consequence NASA tolerate a risk of 1 disaster per 15 missions It becomes clear that the chance of a disaster occurring needs to be quantified if we are to design a safety control system that must meet a specific safety level.
Tolerable Risk and Consequence 2-3 December 1984 Toxic fumes leak from site Union Carbide Plant, Bhopal 3787 people die – Was this tolerable?? - Severe legal implications on 9 May 2003 - 2 Survivors addressed Dow Chemicals Shareholders - Accountability for health and environmental impacts
Analysing the Risk • Consider safety implications in all operating states of the plant: • Process shut down • Process starting up • Process operating normally • Process operating abnormally • Process shutting down in controlled conditions • Process shutting down in emergency conditions
Analysing the Risk • The Goal: • No one single event should lie between • a safe situation and catastrophe
Process Risks Risk is mathematically expressed as the product of the expected frequency or probability that a hazardous event will occur and its consequences. High risk with low frequency may be acceptable. The Plant Manager and Maintenance Manager will always differ on acceptability. If risks are too high, take risk reduction measures.
Design Considerations IEC61508 3-Point Strategy: 1. Specify the safety requirements of the system (Hazard and Risk Analysis) 2. Design a system to meet those requirements, taking into account all possible causes of failure (Random, Systematic, Human) 3. Accommodate faults that may be introduced at any point in the lifecycle
How do we quantify failure…?? • MTTF- MEAN time taken for a failure to occur • MTTR - MEAN time taken to repair • MTBF = MTTF+MTTR (MEAN time between successive failures) • Remember a MTBF of 20 years doesn’t mean it won't fail tomorrow. All MTBF data is based on assumptions - are the numbers realistic…..????
The Failure Rate "Bathtub Curve" Quoted Failure Rate Instrument Faults / year Pressure Switch 0.14 Controller 0.29 Flow Switch 1.12 pH Meter 5.88 According to Frank Lees
How often will my system fail…?? • Single component • MTBF • Multiple components in series • Failure Rate SYS = FR1 + FR2 + FR3 ……… + FRn • Multiple components in parallel • System is degraded until the faulty component is repaired. • The MTTR is often unrealistic, eg. if the component is on an oil platform and there are no spares on board how long will it take to ship the replacement?
IEC 61508 PFD Duplex Calculation Probability of Failure on Demand These calculations are essential. Without them a Safety Integrity Level cannot be determined.
Safety Integrity Levels (SIL) SIL does not attempt to quantify the risk, only the probability of a certain action occurring
S Act 2003 1oo2D S 1oo2D 2003 Electronic Interface Act S A Sample System Sensor component Logic system component Final element component Electronic Interface Electronic Interface l = 5x10 -6 hr -1 DC = 60% Voting = 1oo1 Electronic Interface Electronic Interface l = 5x10 -6 hr -1 b = 10% DC = 90% Voting = 2oo3 l = 10x10 -6 hr -1 b = 1% DC = 99% Voting = 1oo2D l = 10 x10 -6 hr -1 DC = 60% Voting = 1oo1
System Calculation • Proof Test = 1 year • Sensing Element, PFDSE = 2.3 x 10 -4 • Logic Solving Element, PFDLS = 4.8 x 10⁻⁶ • Final Element, PFDFE = 4.4 x 10⁻³ + 8.8 x 10 -3 • = 1.32x 10 -2 • Therefore, for the safety function, • PFDAVG = 2.3 x 10⁻⁴ + 4.8 x 10⁻⁶ + 1.32 x 10⁻² • = 1.34 x 10⁻² • = Safety Integrity Level 1
Improving the system to SIL2 • Change proof test interval to 6 months • PFDSE = 1.1 x 10⁻⁴ • PFDLS = 2.6 x 10⁻⁶ • PFDFE = 2.2 x 10⁻³ + 4.4 x 10-3 = 6.6 x 10⁻³ • PFDAVG = 6.7 x 10⁻³ • =SIL 2 • Change the 1oo1 shutdown valve to 1oo2 • PFDSE = 2.3 x 10⁻⁴ • PFDLS = 4.8 x 10⁻⁶ • PFDFE = 4.4 x 10⁻³ + 0.97 x 10 -3 = 5.4 x 10⁻³ • PFDAVG = 5.6 x 10⁻³ • =SIL 2
Availability Availability is the probability that the system is actually running at any given moment in time • A = MTTF MTTF + MTTR • Availability Downtime • 90% 36.5 days/year • 99% 3.65 days/year • 99.9% 8.76 hours/year • 99.99% 52 minutes/year • 99.999% 5 minutes/year • 99.9999% 31 seconds/year
Reliability Reliability is the probability that the system will actually perform its required function, without failure, for a specified time interval.
Providing Control System Integrity If the risk has not been reduced to an acceptable level, as is the case in of many critical processes, the next logical step then is to define the control system architecture required to achieve the overall system performance. Several types and formats of control system architectures exist. Techniques such as redundancy, configuration, quality, and diagnostic coverage are important contributors to increased system availability and reliability.
Genius Genius Genius Genius Simplex System 1oo1D(de-energise to trip) SIL 2 TUV 4 Fail Safe I - pattern
Genius Genius Genius Genius Duplex System 1oo2D <to> 1oo1D (to de-energize trip) SIL 3 I - pattern TUV 6 Fail Safe
Genius Genius Genius Genius Duplex System 2oo2 <to> 1oo1D (to energize trip) SIL 2 TUV 4 T - pattern Fault Tolerant
Genius Genius Genius Genius Genius Genius Duplex System 1oo2D / 2oo2 <to> 1oo1D (to trip) SIL 3 TUV 6 Fail Safe SIL 2 TUV 4 Fault Tolerant H - pattern
Genius Genius Genius Genius Genius Genius Genius Triplex System 2oo3 (TMR) <to> 1oo2D <to> 1oo1D (to trip) SIL 3 TUV 6 H - pattern Fail Safe & Fault Tolerant
Agenda Introduction Specifications, Standards and Models Risk and Design Trends GE Product Offerings Conclusion
The Generations of Process Control 1960-1980 First Generation • Pneumatic / Hydraulic Control / Mechanical Control 1980 Second Generation • Single Loop Controller (Basic, Pascal, C) • Distributed Single Loop Controller • Visualization & Recording (paper) • Digital Recording & Trending 1989-2001 Third Generation • DCS 2001-Future Fourth Generation • PAC, Hybrid DCS to replace DCS • Digital Cockpit • Collaborative Production • Plant Life Cycle Management
Programmable Automation Controllers (PAC) Launched in the second half of 2003 1. The latest and fastest CPU’s 2. Micro Second execution times • Single Control Engine for All Hardware Platforms RX3i RX7i
PACSystems – CPU Redundancy Control Memory Exchange • 2.12GB • 256 nodes in a ring, up to 10km • Just Memory - Read it & Write it • Each network node has a local copy of all the data • GE Fanuc Patented technology • Increased safety on Critical Control Applications RX7i RX7i
Collaborative Production Management • Aligns your manufacturing IT investments with your business strategy • Benefits are lower cost of doing business and • achieving competitive advantage.
Agenda Introduction Specifications, Standards and Models Risk and Design Trends GE Product Offerings Conclusion