Download
1 / 59
590 likes | 697 Views
Livelihoods at the Limit. A Fresh Look at the Evidence. What HEA data from 316 livelihood zones in 26 countries can tell us about food security & disaster risks . Overview. What is Household Economy Analysis – a very brief review & where the data that informs these papers comes from

E N D
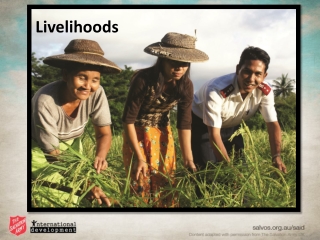
Livelihoods at the Limit A Fresh Look at the Evidence What HEA data from 316 livelihood zones in 26 countries can tell us about food security & disaster risks
Overview • What is Household Economy Analysis – a very brief review & where the data that informs these papers comes from • Food Security paper three questions with policy implications • DRR/CCA paper three questions with preliminary conclusions • Areas of potential further research
What is Household Economy Analysis? Step 1. Livelihood Zoning Areas within which people share broadly the same pattern of livelihood – the same production base, and the same market system. Livelihoods at the Limit: The Food Economy Group & Save the Children UK
What is Household Economy Analysis? At least 8 villages or sites in one livelihood zone are chosen for in-depth field work Step 2. Wealth Breakdown Livelihoods at the Limit: The Food Economy Group & Save the Children UK
What is Household Economy Analysis? For each wealth group, sources of food and cash income and expenditure patterns are quantified Step 3. Quantification of Baseline Livelihood Strategies 32 X Livelihoods at the Limit: The Food Economy Group & Save the Children UK
What is Household Economy Analysis? Livelihoods at the Limit: The Food Economy Group & Save the Children UK
What is Household Economy Analysis? These first three steps comprise a HEA Baseline The next three steps are part of Outcome Analysis Livelihoods at the Limit: The Food Economy Group & Save the Children UK
What is Household Economy Analysis? Outcome Analysis is a mathematical process that allows us to see how a population’s access to food and cash income is affected by a change, such as drought, market closure, or even a development intervention. Livelihoods at the Limit: The Food Economy Group & Save the Children UK
What is Household Economy Analysis? 50% of baseline crops Livelihoods at the Limit: The Food Economy Group & Save the Children UK
What is Household Economy Analysis? 200% of normal staple prices Livelihoods at the Limit: The Food Economy Group & Save the Children UK
Where does the data for these papers come from? Distribution of livelihood zones with full baseline coverage Other: 6 Sahel & West Africa: 40 Southern Africa: 60 East Africa/GHA: 204 Asia: 6 Number of livelihood zones in each category Cropping: 233 Agro-pastoral: 40 Pastoral: 31 Urban: 12 Livelihoods at the Limit: The Food Economy Group & Save the Children UK
Food Security in a Changing World Drew on HEA Baselines to explore: • What does it mean to be poor in rural areas today and how does this relate to food security? • What part does cash play in rural livelihoods? • Should the livestock sector get priority attention? Livelihoods at the Limit: The Food Economy Group & Save the Children UK
Food Security in a Changing World Sources of Food: All Rural Livelihood Zones By Wealth Group If you are poor or very poor, more than half of your food comes from off of your farm Livelihoods at the Limit: The Food Economy Group & Save the Children UK
Food Security in a Changing World On average, better off households produce enough food to cover twice their households’ minimum calorie requirements. They buy food to diversify, while very poor households buy food to fill a real gap. Total Income: All Rural Livelihood Zones By Wealth Group Surplus Gap Livelihoods at the Limit: The Food Economy Group & Save the Children UK
Food Security in a Changing World Looking at agricultural, agro-pastoral and pastoral zones. Sources of Food: By Livelihood Zone Type & Wealth Group Very Poor Poor Middle Better Off
Food Security in a Changing World The heavy purchase requirement for rural poor households is reflected in their expenditure patterns Expenditure Patterns: All Rural Livelihood Zones
Food Security in a Changing World Policy Implication At least one of the reasons for continued malnutrition is the fact that poorer households can neither produce nor purchase enough of the right kind of food. A combination of strategies is needed to improve access to nutrients essential for the well-being of mothers and for the growth of children. Livelihoods at the Limit: The Food Economy Group & Save the Children UK
Food Security in a Changing World • What does it mean to be poor in rural areas today and how does this relate to food security? • What part does cash play in rural livelihoods? • Should the livestock sector get priority attention? Drew on HEA Baselines to explore: Livelihoods at the Limit: The Food Economy Group & Save the Children UK
Food Security in a Changing World Cash as a Percent of Total Income By Wealth Group: All Rural Zones Rural economies are increasingly cash-based. Livelihoods at the Limit: The Food Economy Group & Save the Children UK
Food Security in a Changing World Sources of Cash Income: All Rural Livelihood Zones The poorer you are, the more you need to sell your own labour to get cash. Livelihoods at the Limit: The Food Economy Group & Save the Children UK
Food Security in a Changing World The wealthier you are, the more you cash in on your productive assets (land, livestock and human capital). Sources of Cash Income by Livelihood Zone Type and Wealth Very Poor Poor Middle Better Off
Food Security in a Changing World For the rural population as a whole,crop sales are not always the most important source of cash, even in cropping zones. Sources of Cash Income by Geographic Region: Cropping Zones Crop sales Crop sales Crop sales Crop sales Crop sales
Food Security in a Changing World Policy Implication Since the majority of poor and very poor households obtain most of their food and cash income from sources other than their own crop production, it makes sense to consider an array of support and investment options outside the realm of smallholder agriculture. Livelihoods at the Limit: The Food Economy Group & Save the Children UK
Food Security in a Changing World Policy Implication One of the key characteristics of being poor is that your most important capital is your own labour. Finding ways to support and protect the income from local and seasonal migratory labour should be a top priority. Livelihoods at the Limit: The Food Economy Group & Save the Children UK
Food Security in a Changing World • What does it mean to be poor in rural areas today and how does this relate to food security? • What part does cash play in rural livelihoods? • Should the livestock sector get priority attention? Drew on HEA Baselines to explore: Livelihoods at the Limit: The Food Economy Group & Save the Children UK
Food Security in a Changing World Total Income (food & cash) Income from livestock Income from livestock Income from livestock Income from livestock East Africa Sahel East Africa Sahel Agro-pastoral Zones Pastoral Zones
Food Security in a Changing World Percent of Cash Income from Livestock and Livestock Product Sales Cropping Zones: by wealth group Cropping Zones: by geographic area Livelihoods at the Limit: The Food Economy Group & Save the Children UK
Food Security in a Changing World Areas in Ethiopia where cash income from livestock exceeds cash income from crops Livelihoods at the Limit: The Food Economy Group & Save the Children UK
Food Security in a Changing World Policy Implication Investments in livestock could pay off for all groups. Livelihoods at the Limit: The Food Economy Group & Save the Children UK
Reducing the Risk of Disasters and Adapting to Climate Change Drew on HEA Outcome Analysis to explore: • Which shocks have the most damaging impact on households? • Does diversification always help reduce the risk of disaster? • Will increasing poor households’ agricultural production increase their resilience? Livelihoods at the Limit: The Food Economy Group & Save the Children UK
Reducing the Risk of Disasters and Adapting to Climate Change In an earthquake…. Natural Hazards Formulation Hazard + Vulnerability Risk = Location and Magnitude of Quake Structural Integrity Building Collapse
Reducing the Risk of Disasters and Adapting to Climate Change In food and livelihood security…. This is the focus of most resilience programmes DRR Formulation Risk = f (Hazard, Vulnerability, Capabilities) Extreme food or livelihood Insecurity Nature, location and magnitude of shocks Household and regional economic systems in relation to shock(s) People’s capacity to cope on their own
Reducing the Risk of Disasters and Adapting to Climate Change Livelihood Zone Clusters 1st source staple crops 2nd source cash crops 1st source staple crops 2nd source livestock 1st source staple crops 2nd source local labour Livelihoods at the Limit: The Food Economy Group & Save the Children UK
Reducing the Risk of Disasters and Adapting to Climate Change Crop shock Across the board, the crop and purchase shocks result in the largest proportion of the population affected. But the labour and livestock shocks also create big problems in specific zones. Livestock shock Labour shock Purchase shock
Reducing the Risk of Disasters and Adapting to Climate Change Crop shock A more accurate basis for early warning Monitor livestock and purchase shocks in this cluster Livestock shock Labour shock Purchase shock
Reducing the Risk of Disasters and Adapting to Climate Change Crop shock A more accurate basis for early warning Make sure you are monitoring the most important crops for food and cash income in these clusters Livestock shock Labour shock Purchase shock
Reducing the Risk of Disasters and Adapting to Climate Change Crop shock A more accurate basis for early warning Spend some extra money to collect monthly data on local wage rates here as well as monitor staple food prices Livestock shock Labour shock Purchase shock
Food Security in a Changing World Conclusion A livelihood-calibrated early warning system is essential for accurate early response. Without the livelihood context you get an early warning of the hazard, not the outcome. Livelihoods at the Limit: The Food Economy Group & Save the Children UK
Food Security in a Changing World Conclusion Across all livelihood zones price shocks create deficits, second only to crop shocks. Poorer rural households are heavily reliant on purchasing their food. Price shocks reduce food access in rural as well as urban areas. Livelihoods at the Limit: The Food Economy Group & Save the Children UK
Reducing the Risk of Disasters and Adapting to Climate Change Drew on HEA Outcome Analysis to explore: • Which shocks have the most damaging impact on households? • Does diversification always help reduce the risk of disaster? • Will increasing poor households’ agricultural production increase their resilience? • What hazards are pastoralists most vulnerable to? What does resilience mean in a pastoralist economy? Livelihoods at the Limit: The Food Economy Group & Save the Children UK
Reducing the Risk of Disasters and Adapting to Climate Change Drought Scenario 50% of baseline crop production 50% of baseline income from crop sales Crop shock 25% of baseline milk/meat 40% of income from livestock sales Livestock shock 75% of in-kind payment for local labour 55% of baseline income from local labour Labour shock 75% of baseline income from self employment Self-employment shock Doubling of food prices Purchase shock Note: People’s coping capacity expands when one income source is reduced. These analyses include this expansion of coping to the extent that it does not harm people’s basic livelihoods.
Reducing the Risk of Disasters and Adapting to Climate Change • The Survival Thresholdis the line below which intervention is required to save lives. • It is the total food and cash income required to cover • A) 100% of minimum food energy needs (2100 kcals per person), • B) the costs associated with food preparation and consumption (i.e. salt, soap • kerosene and/or firewood for cooking and basic lighting), • any expenditure on water for human consumption Livelihoods at the Limit: The Food Economy Group & Save the Children UK
Reducing the Risk of Disasters and Adapting to Climate Change • The Livelihoods Protection Thresholdis the line below which an intervention is required to maintain existing livelihood assets • It represents the total total expenditure to: • A) ensure basic survival (see above), • maintain access to basic services (e.g. routine medical and schooling • expenses), • C) sustain livelihoods in the medium to longer term (e.g. regular purchase of seeds, inputs vet drugs); • ensure a locally acceptable standard of living (e.g. coffee, berberi)
Reducing the Risk of Disasters and Adapting to Climate Change The most diverse income portfolios are on the left…. Baseline Total Income for Poor Households in Six Livelihood Zones …and so are the biggest deficits. Outcome after Drought Scenario for Same Six Livelihood Zones
Reducing the Risk of Disasters and Adapting to Climate Change The same results emerge when we look at the entire dataset. After the drought scenario, the deficit is bigger for the high-diversity households. Post-Drought Scenario Results for Poor Households, Grouped by Diversity Level Livelihoods at the Limit: The Food Economy Group & Save the Children UK
Reducing the Risk of Disasters and Adapting to Climate Change The better off have less diverse incomes in almost every instance. Zimbabwe Cropping Zone Ethiopia Cropping Zone Niger Agro-pastoral Zone Kenya Pastoral Zone Very poor Better off Very poor Better off Very poor Better off Very poor Better off Livelihoods at the Limit: The Food Economy Group & Save the Children UK
Food Security in a Changing World Preliminary Conclusion It is worth questioning whether resilience can be built and risk reduced in rural areas by diversifying incomes. More evidence is needed to prove the effectiveness of this strategy. Livelihoods at the Limit: The Food Economy Group & Save the Children UK
Reducing the Risk of Disasters and Adapting to Climate Change Drew on HEA Outcome Analysis to explore: • Which shocks have the most damaging impact on households? • Does diversification always help reduce the risk of disaster? • Will increasing poor households’ agricultural production increase their resilience? Livelihoods at the Limit: The Food Economy Group & Save the Children UK
Reducing the Risk of Disasters and Adapting to Climate Change Agricultural Investment Scenario 25% increase in yield on a ¼ hectare resulting from the investment of improved seed and fertiliser Increase in Livelihoods Protection Threshold reflecting extra cost of seeds and fertilisers 15% of annual calories added to household food income = + Livelihoods at the Limit: The Food Economy Group & Save the Children UK
Reducing the Risk of Disasters and Adapting to Climate Change The investment in agriculture does little to reduce the % of the population with a post-drought deficit….. Population with a Livelihoods Protection Deficit Livelihoods at the Limit: The Food Economy Group & Save the Children UK