Download
1 / 37
370 likes | 660 Views
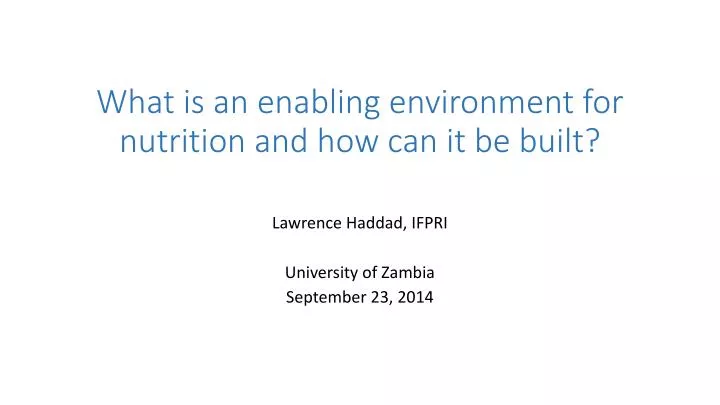
What is an enabling environment for nutrition and how can it be built?. Lawrence Haddad, IFPRI University of Zambia September 23, 2014. Enabling Environments Make it Easier for Everyone to Contribute to Nutrition Improvement. Building Awareness Making Commitments Governance arrangements

E N D
What is an enabling environment for nutrition and how can it be built? Lawrence Haddad, IFPRI University of Zambia September 23, 2014
Enabling Environments Make it Easier for Everyone to Contribute to Nutrition Improvement Building Awareness Making Commitments Governance arrangements Mobilising Resources Holding Stakeholders to Account Capacity and Data to support 1-5
Human Brain Development Thompson, R. A., & Nelson, C. A. (2001). Developmental science and the media: Early brain development. American Psychologist,56(1), 5-15.
The Demographic Dividend will only be fully realisedat low levels of undernutrition Bloom, D. and D. Canning. January 2011. Demographics and Development Policy. PGDA Working Paper No. 66. Harvard University
Effective framing of how little attention nutrition gets in aid spending
Reasons for Weak Commitment to Nutrition Malnutrition is usually invisible to malnourished families and communities. Families and governments do not recognise the human and economic costs of malnutrition. Governments may not know there are faster interventions for combating malnutrition than economic growth and poverty reduction or that nutrition programmes are affordable. Because there are multiple organisational stakeholders in nutrition, it can fall between the cracks. Malnourished people have little voice. Governments sometimes claim that they are investing in improving nutrition when the programmes they are financing have little effect on it Adapted from Heaver, Richard. 2005. Strengthening Country Commitment to Human Development: Lessons from Nutrition. Washington, DC : World Bank. https://openknowledge.worldbank.org/handle/10986/7310
Civil Society, Galvanising Commitment: Hunger and Nutrition Commitment Index (HANCI)
HANCI political commitment groupings by Gross National Income per capita
Commitment to Nutrition is Not the Same as a Commitment to Hunger Reduction
Locking in Commitment Nutrition and the post 2015 Development Goals
Need for a more in depth and political analysis of nutrition governance
Doing the right things in the right orderPrioritising and sequencing Source: Doing Growth Diagnostics in Practice: A ‘Mindbook’ Ricardo Hausmann, Bailey Klinger, Rodrigo Wagner CID Working Paper No. 177 September 2008. Harvard University.
Multistakeholder action—how coordinated does it have to be? As coordinated as it needs to be • Broad based action • Political shift in national identity, e.g. Brazil • Perfect storm: Good things happening for nutrition in a number of areas, some planned, some not e.g. Maharashtra • “Think intersectorally, act sectorally” • Convergence, e.g. India, open defecation • Coordination, e.g. SUN national plans of action • Integrated action • Embedded components, e.g. DFID in Bangladesh • New interventions, e.g. HKI in Burkina Faso
Composition of costed country nutrition plans, SUN members Planning and costing for the acceleration of actions for nutrition: experiences of countries in the Movement for Scaling Up Nutrition. SUN. May 2014. www.scalingupnutrition.org
How much money is needed for nutrition specific interventions? $4bn additional donor funding pledged at Nutrition 4 Growth Summit Donor scale up $10bn Donor $20bn $10bn extra spendingrequired/year 7 years 2013-2020 Total $70bn Domestic $50bn
Resources for Nutrition: Look everywhere but be guided by a plan, with checks and balances
Different Spending Categories for Nutrition Nutrition Sensitive
The Private Sector and nutrition: why bother? • The private sector already plays a large role in delivering to people in poor countries • foods, health care, water and sanitation • in India, private health services accounted for 56 percent of health care use in the poorest households • Private sector has enormous logistical reach which could serve the poorest • in many developing countries, the private sector owns and manages 40 to 50 percent or more of the country’s health infrastructure • Private sector may need the public sector to expand reach the poorest • Subsidies in rural areas • Increase demand through public health campaigns • Regulation and tax changes could make private sector more pro-nutrition Adapted from: Partnerships with the Private Sector in Health. What the International Community Can Do to Strengthen Health Systems in Developing Countries. Final Report of the Private Sector Advisory Facility Working Group. April Harding, Chair November 2009
The Private Sector: Improving the nutrition status of the poorest while making a profit—can it be done? Improving nutrition outcomes for the poorest Making a profit Strengthening the enabling environment for nutrition When does this overlap exist?
Making Commitment Transparent Public Commitments: Mentions of Nutrition • In Speeches (from Jan 2005-end 2006) • DFID: 0/50 • EC: 0/28 • In Press releases (from Jan 2005-end 2006) • DFID: 0/197 • EC: 0/239 • In policy documents • 0 in G8 2005 and 2006 • 12 in Commission for Africa Report • 0 in DFID Social transfers and chronic poverty • 0 in European Consensus on Development Source: Sumner, Lindstrom and Haddad 2007. IDS Sussex
Citizen Feedback: Are nutrition programmes working? Randomised control trial of community-based monitoring of public primary health care providers in Uganda • Citizen report cards reduced child mortality by 33 per cent • The study documents large increases in utilisation and improved health outcomes • Cost per child death averted was $300, well below the average of $887 for 23 other interventions. Björkman, M and Svensson, J. (2009) 'Power to the People: Evidence from a Randomized Field Experiment on Community Based Monitoring in Uganda’, The Quarterly Journal of Economics, Vol 124: 2, pp 735–69
Cumulative donor spending commitments on nutrition specific and sensitive programmes : 12 major donors SUN Donor Network. June 2014.
SUN Review of Nutrition Budget Data Availability • General budget allocation information was publicly accessible for only 32 of 51 SUN countries • 28 of the 32 countries had up to date information • 21 of the 28 country budgets had the necessary detail at the programme level to be able to assign line items in different departments to nutrition • In 10 of 21 countries there was a clear nutrition programme which helps to make some nutrition spending more visible • Budgetary analyses like this are incomplete because they frequently exclude recurrent costs such as staff costs • Information on actual expenditure is scarce • Different countries use different methods to track budget allocations and expenditures on health, including: Public Expenditure Reviews (PER), National Health Accounts (NHA), the Clinton Health Access Initiative (CHAI) Resource Mapping Tool, and Public Expenditure Tracking Surveys (PETS). See Picanyol, C. and P. Fracassi (2014). “Tracking Investments at Country Level”, draft, 16th of June. SUN Secretariat .
6. Capacity and data gaps that make an environment less enabling
System capacity to address malnutrition is inadequate -- and opportunities are limited Maternal and child undernutrition: effective action at national level Jennifer Bryce, Denise Coitinho, Ian Darnton-Hill, David Pelletier, Per Pinstrup-Andersen, Lancet 2008.
India: Filling front line vacancies to reduce child stunting in Maharashtra • Even in Maharashtra, the wealthiest state in India, 39 per cent of children under age 2 were stunted in 2005–2006. But by 2012, according to a statewide nutrition survey, the prevalence of stunting had dropped to 23 per cent • The State Nutrition Mission began by working to improve the effectiveness of service delivery through the Integrated Child Development Services and the National Rural Health Mission, the national flagship programmes for child nutrition, health and development. • Their focus was on filling vacancies in key personnel, particularly front-line workers and supervisors, and on improving their motivation and skills to deliver timely, high-quality services in communities. Unicef 2013 Report
Individual capacity can make a difference: Health Centre Workers in India, asked, without prompting, “what is important for keeping a child healthy and strong?” www.hungamaforchange.org/
Evidence Gaps • Data on current capacity levels • Better tools on how to sequence and prioritize all nutrition actions • More evidence and impact evaluations on how the private sector can best add value • Systems that allow governments to track nutrition spending easily and accurately
Summary • Building Awareness – tap into your audience • Making Commitments – identify them, make public • Governance arrangements – don’t get stuck on a model of horizontal coordination, don’t forget about vertical coordination • Mobilising Resources—make sure they are driven by a plan • Holding Stakeholders to Account – transparency and civil society are key • Capacity and Data to support 1-5 – transparency and holding to account requires data