Download
1 / 1
10 likes | 70 Views

E N D
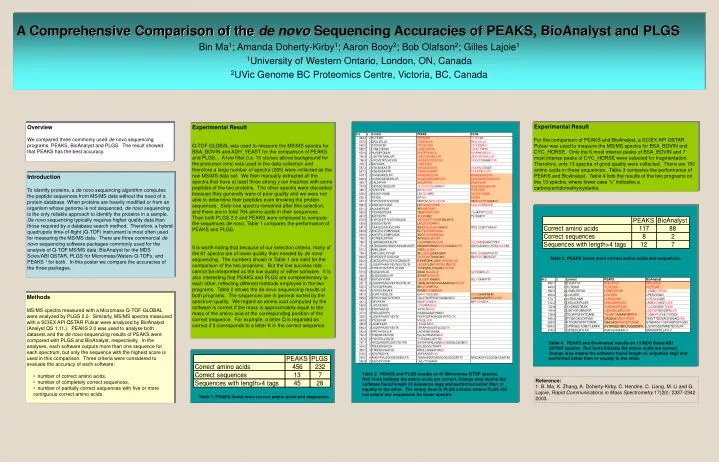
Table 2. PEAKS and PLGS results on 61 Micromass QTOF spectra. Red fonts indicate the amino acids are correct. Orange area means the software found length 5 sequence tags and performed better than or equally to the other. The empty lines in PLGS column means PLGS did not output any sequences for those spectra. Table 1. PEAKS found more correct amino acids and sequences. A Comprehensive Comparison of the de novo Sequencing Accuracies ofPEAKS, BioAnalyst and PLGS Bin Ma1; Amanda Doherty-Kirby1; Aaron Booy2; Bob Olafson2; Gilles Lajoie1 1University of Western Ontario, London, ON, Canada 2UVic Genome BC Proteomics Centre, Victoria, BC, Canada Experimental Result For the comparison of PEAKS and BioAnalyst, a SCIEX API QSTAR Pulsar was used to measure the MS/MS spectra for BSA_BOVIN and CYC_HORSE. Only the 6 most intense peaks of BSA_BOVIN and 7 most intense peaks of CYC_HORSE were selected for fragmentation. Therefore, only 13 spectra of good quality were collected. There are 150 amino acids in these sequences. Table 3 compares the performance of PEAKS and BioAnalyst. Table 4 lists the results of the two programs on the 13 spectra, where lower case “c” indicates a carboxyamidomethylcysteine. Overview We compared three commonly used de novo sequencing programs, PEAKS, BioAnalyst and PLGS. The result showed that PEAKS has the best accuracy. Experimental Result Q-TOF GLOBAL was used to measure the MS/MS spectra for BSA_BOVIN and ADH_YEAST for the comparison of PEAKS and PLGS. . A low filter (i.e. 10 cts/sec above background for the precursor ions) was used in the data collection and therefore a large number of spectra (265) were collected as the raw MS/MS data set. We then manually extracted all the spectra that have at least three strong y-ion matches with some peptides of the two proteins. The other spectra were discarded because they generally were of poor quality and we were not able to determine their peptides even knowing the protein sequences. Sixty-one spectra remained after this selection, and there are in total 764 amino acids in their sequences. Then both PLGS 2.0 and PEAKS were employed to compute the sequences de novo. Table 1 compares the performance of PEAKS and PLGS. It is worth noting that because of our selection criteria, many of the 61 spectra are of lower quality than needed by de novo sequencing. The numbers shown in Table 1 are valid for the comparison of the two programs. But the low success rate cannot be interpreted as the low quality of either software. It is also interesting that PEAKS and PLGS are complementary to each other, reflecting different methods employed in the two programs. Table 2 shows the de novo sequencing results of both programs. The sequences are in general sorted by the spectrum quality. We regard an amino acid computed by the software is correct if the mass is approximately equal to the mass of the amino acid at the corresponding position of the correct sequence. For example, a letter Q is regarded as correct if it corresponds to a letter K in the correct sequence. Introduction To identify proteins, ade novo sequencing algorithm computes the peptide sequences from MS/MS data without the need of a protein database. When proteins are heavily modified or from an organism whose genome is not sequenced, de novo sequencing is the only reliable approach to identify the proteins in a sample. De novo sequencing typically requires higher quality data than those required by a database search method. Therefore, a hybrid quadrupole time-of-flight (Q-TOF) instrument is most often used for measuring the MS/MS data. There are three commercial de novo sequencing software packages commonly used for the analysis of Q-TOF MS/MS data: BioAnalyst for the MDS Sciex/ABI QSTAR, PLGS for Micromass/Waters Q-TOFs, and PEAKS 1 for both. In this poster we compare the accuracies of the three packages. Table 3. PEAKS found more correct amino acids and sequences. • Methods • MS/MS spectra measured with a Micromass Q-TOF GLOBAL were analyzed by PLGS 2.0. Similarly, MS/MS spectra measured with a SCIEX API QSTAR Pulsar were analyzed by BioAnalyst (Analyst QS 1.11.). PEAKS 2.0 was used to analyse both datasets and the de novo sequencing results of PEAKS were compared with PLGS and BioAnalyst, respectively. In the analyses, each software outputs more than one sequence for each spectrum, but only the sequence with the highest score is used in this comparison. Three criteria were considered to evaluate the accuracy of each software: • number of correct amino acids, • number of completely correct sequences, • number of partially correct sequences with five or more contiguous correct amino acids. Table 4. PEAKS and BioAnalyst results on 13 MDS Sciex/ABI QSTAR spectra. Red fonts indicate the amino acids are correct. Orange area means the software found length 5 sequence tags and performed better than or equally to the other. Reference: 1. B. Ma, K. Zhang, A. Doherty-Kirby, C. Hendrie, C. Liang, M. Li and G. Lajoie, Rapid Communications in Mass Spectrometry 17(20): 2337-2342. 2003.