Download

1 / 20
200 likes | 313 Views
Evaluating Predictive Models of Software Quality. Vincenzo Ciaschini , Marco Canaparo , Elisabetta Ronchieri , Davide Salomoni INFN CNAF, Bologna, Italy CHEP 2013, October 14 - 18, 2013, Amsterdam, The Netherlands. Motivation.

E N D
Evaluating Predictive Models of Software Quality Vincenzo Ciaschini, Marco Canaparo, ElisabettaRonchieri, DavideSalomoni INFN CNAF, Bologna, Italy CHEP 2013, October 14 - 18, 2013, Amsterdam, The Netherlands
Motivation • Can we predict whether our products and processes will meet goals for quality during the development life cycle? • Specifically, can we determine the risk factor associated to our products in relation to reliability and maintainability in order to prevent faults? CHEP 2013, October 14 - 18, 2013, Amsterdam, The Netherlands
Why? Motivation again • To produce better software at lower cost with predictable resource allocations and time estimations. • To detect defects from faults early in order to mi their consequences. • To estimate time to the products’ deployment. • To predict and improve quality of the products and the development process. CHEP 2013, October 14 - 18, 2013, Amsterdam, The Netherlands
What? Background • The predictive model of software quality determines software quality level periodically and indicates software problems early. • Over the last few decades several predictive methods have been used in the development of fault predictive models: • Regression; • Statistical; • Machine learning; • Others. CHEP 2013, October 14 - 18, 2013, Amsterdam, The Netherlands
Context? Background • The main context of these models is closed to NASA’s based projects: however open source systems are also considered. • The C/C++ language dominates in the studies of these models [1]: • Over half of the models are built by analysing C/C++ code; • 20% of models are for Java code. CHEP 2013, October 14 - 18, 2013, Amsterdam, The Netherlands
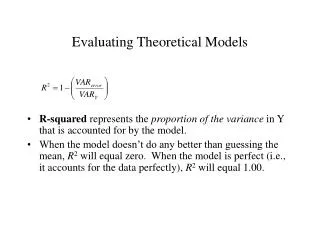
Measure of performances? Background • In case of continuous output data, the performance of models is based on: • Error rates such as mean square error, mean absolute error, standard error, and absolute error; • Regression coefficients such as regression R2 (linear), cubic R2, and regression R2 (non-linear); • Correlation test such as Pearson and Spearman; • Variance significance test such as goodness-of-fit, Chi-Square and p-value. CHEP 2013, October 14 - 18, 2013, Amsterdam, The Netherlands
Experiment Description • The experiment consists of evaluating software quality of some EMI products by using predictive models: • As first approximation, we have selected the INFN software products of the EMI distributions [2] (i.e. EMI 1, EMI 2, and EMI 3), such as CREAM, StoRM, VOMS, WMS, WNoDeS, and parts of YAIM; • We have measured some static metrics [3] such as N. Files, N. Comments, N. Code, N. Languages, N. Blanks, and McCabe, for all the software products in each EMI distribution; • We have used open source tools to measure the metrics such as cloc [4], pmccabe [5] and radon [6]; • We have collected defects from the release notes of each software products [7]; • We have used statistical predictive model based on the discriminant analysis [8], [9], [10]. CHEP 2013, October 14 - 18, 2013, Amsterdam, The Netherlands
Software Packages ‘x’ means that the specified source package in a EMI distribution has been updated. CHEP 2013, October 14 - 18, 2013, Amsterdam, The Netherlands
Software Packages ‘x’ means that the specified source package in a EMI distribution has been updated. CHEP 2013, October 14 - 18, 2013, Amsterdam, The Netherlands
Metrics DIRECT MEASURES INDIRECT MEASURES CHEP 2013, October 14 - 18, 2013, Amsterdam, The Netherlands
Metrics Tools CHEP 2013, October 14 - 18, 2013, Amsterdam, The Netherlands
Size Metrics’ Measures Interpretation • Per software products (CREAM, VOMS, StoRM, WMS, WNoDeS, YAIM) in each EMI distribution: • The following considerations are per software packages in each distribution. CHEP 2013, October 14 - 18, 2013, Amsterdam, The Netherlands
McCabe Complexity Metric’s Measures Interpretation • The measure of this metric provides for each block the score of complexity ranked as follows [6]: • 1-5: low- simple block; • 6-10 : low-well structured and stable block; • 11-20: moderate-slightly complex block; • 21-30: more than moderate – more complex block; • 31-40: high-complex block, alarming; • 41+: very high-error prone. • The following considerations are for software products in each distribution: • Concerning the C/C++ code: • the main cause is the inclusion of external software in the package like std2soap.c file; • furthermore these types of blocks remain constant or increase over the EMI distributions. CHEP 2013, October 14 - 18, 2013, Amsterdam, The Netherlands
INFN Quality Measures: Defects • Per software products (CREAM, VOMS, StoRM, WMS, WNoDeS, YAIM) in each EMI distribution: • Defects decreased over the EMI distributions with the exclusion of VOMS and StoRM products. • They were related to code, build and package, documentation. Defect Density vs software product size Defect Density = N. Defects / N. Code Defects per N. Code Defect Density N. Code CHEP 2013, October 14 - 18, 2013, Amsterdam, The Netherlands
Statistical Evaluation • Considering all the software products (i.e. CREAM, VOMS, StoRM, WMS, WNoDeS, and YAIM) and the collected data for size, complexity and quality metrics, for each distribution firstly: • we have determined the level of risk/importance of each metric, and the level of risk of each software product to be fault prone by considering the discriminant analysis method that is the most suitable method in finding fault prone software products [9]; • we have predicted the defects by using size and complexity metrics [10]. • Secondly we have evaluated the impact of this information in the EMI distributions. CHEP 2013, October 14 - 18, 2013, Amsterdam, The Netherlands
Statistical Evaluation The minimum value The maximum value CHEP 2013, October 14 - 18, 2013, Amsterdam, The Netherlands
Statistical Evaluation CHEP 2013, October 14 - 18, 2013, Amsterdam, The Netherlands
Statistical Evaluation CREAM WMS VOMS WNoDeS YAIM StoRM CHEP 2013, October 14 - 18, 2013, Amsterdam, The Netherlands
Conclusions • Considering the available data and the detected defects the statistical model with the discriminant analysis method predicted the risk of being fault prone with a precision of 83%. This does not translate to precision in determining the number of defects, that was indeed wildly inaccurate. • Their inputs are metrics’ measures that can come from existing software. • Their precisions improve with the amount of data available. • The above result shows that the effort necessary to learn this model will be repaid during the testing and quality assurance phase by suggesting which modules are more error prone and therefore should receive greater attention. CHEP 2013, October 14 - 18, 2013, Amsterdam, The Netherlands
References [1] Sara Beecham, Tracy Hall, David Bowes, David Gray, Steve Counsell, Sue Black, “A Systematic Review of Fault Prediction approaches used in Software Engineering”, Lero Technical Report Lero-TR-2010-04. [2] Stephen H. Kan, “Metrics and Models in Software Quality Engineering”, Addison-Wesley Longman Publishing Co., Inc. Boston, MA, USA 2002 [3] Cristina Aiftimiei, Andrea Ceccanti, DaniloDongiovanni, Andrea Di Meglio, Francesco Giacomini, “Improving the quality of EMI Releases by leveraging the EMI Testing Infrastructure,” 2012 Journal of Physics: Conference Series Volume 396 Part 5. [4] CLOC – Count Lines of Code, http://cloc.sourceforge.net. [5] “pmccabe” package: Ubuntu, https://launchpad.net/ubuntu/+source/pmccabe. [6] radon 0.4.3: Python Package Index, https://pypi.python.org/pypi/radon. [7] Releases – European Middleware Initiative, www.eu-emi.eu/release. [8] Jiang Zheng, Laurie Williams, NachiappanNagappan, Will Snipes, John P. Hudepohl, Mladen A. Vouk, “On the value of static analysis for fault detection in software”, IEEE Transaction on Software Engineering, Vol. 32, No. 4, April 2006. [9] GegeGuo, and Ping Guo, “Experimental Study of Discriminant Method with Application to Fault-Prone Module Detection”, Proc. Of 2008 International Conference on Computational Intelligence and Security, December 2008. [10] Norman Fenton, Paul Krause and Martin Neil, “A Probabilistic Model for Software Defect Prediction”, IEEE Transaction on Software Engineering, 2001. CHEP 2013, October 14 - 18, 2013, Amsterdam, The Netherlands