Download
1 / 13

E N D
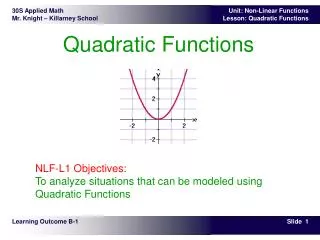
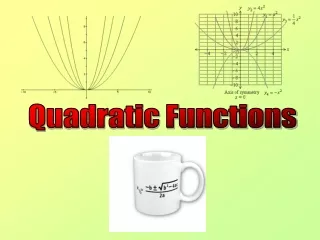
Graphs of Quadratic Functions The graph of any quadratic function is called a parabola. Parabolas are shaped like cups, as shown in the graph below. If the coefficient of x2 is positive, the parabola opens upward; otherwise, the parabola opens downward. The vertex (or turning point) is the minimum or maximum point.
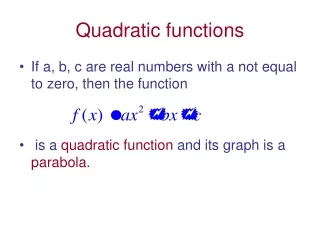
The Standard Form of a Quadratic Function The quadratic function f (x)=a(x - h)2+ k, a 0 is in standard form. The graph of f isa parabola whose vertex is the point (h, k). The parabola is symmetric to the line x = h. If a >0, the parabola opens upward; if a< 0, the parabola opens downward.
Graphing Parabolas With Equations in Standard Form To graph f (x)=a(x - h)2+ k: • Determine whether the parabola opens upward or downward. If a >0, it opens upward. If a < 0, it opens downward. • Determine the vertex of the parabola. The vertex is (h, k). • Find any x-intercepts by replacing f (x) with 0. Solve the resulting quadratic equation for x. • Find the y-intercept by replacing x with zero. • Plot the intercepts and vertex. Connect these points with a smooth curve that is shaped like a cup.
SolutionWe can graph this function by following the steps in the preceding box. We begin by identifying values for a, h, and k. Standard formf (x)=a(x - h)2+ k a = -2 h=3 k=8 Given equationf (x)=-2(x- 3)2+ 8 Text Example Graph the quadratic function f (x)=-2(x- 3)2+ 8. Step 1 Determine how the parabola opens. Note that a, the coefficient of x2, is -2. Thus, a < 0; this negative value tells us that the parabola opens downward.
2(x- 3)2= 8 Solve for x. Add 2(x- 3)2 to both sides of the equation. Text Example cont. Step 2 Find the vertex. The vertex of the parabola is at (h, k). Because h =3and k =8, the parabola has its vertex at (3, 8). Step 3 Find the x-intercepts.Replace f(x) with 0 in f(x)=-2(x- 3)2+ 8. 0 =-2(x- 3)2+ 8Find x-intercepts, setting f(x) equal to zero. (x- 3)2= 4 Divide both sides by 2. (x- 3) =±2 Apply the square root method. x- 3= -2 or x- 3= 2 Express as two separate equations. x= 1 or x= 5Add 3 to both sides in each equation. The x-interceptsare 1 and 5. The parabola passes through (1, 0) and (5, 0).
Step 4 Find the y-intercept. Replace xwith 0 in f(x)=-2(x- 3)2+ 8. f(0) =-2(0 - 3)2+ 8=-2(-3)2+ 8 = -2(9) + 8=-10 The y-intercept is –10.The parabola passes through (0, -10). Text Example cont. Step 5 Graph the parabola.With a vertex at (3, 8), x-intercepts at 1 and 5, and a y-intercept at –10, the axis of symmetry is the vertical line whose equation is x =3.
The Vertex of a Parabola Whose Equation Isf (x)=ax2+ bx + c Consider the parabola defined by the quadratic function f (x)=ax 2+ bx + c. The parabola's vertex is at
Example Graph the quadratic function f (x)=-x2+6x -. Solution: Step 1 Determine how the parabola opens. Note that a, the coefficient of x2, is -1. Thus, a < 0; this negative value tells us that the parabola opens downward. Step 2 Find the vertex. We know the x-coordinate of the vertex is –b/2a. We identify a, b, and c to substitute the values into the equation for the x-coordinate: x = -b/(2a) = -6/2(-1) = 3. The x-coordinate of the vertex is 3. We substitute 3 for x in the equation of the function to find the y-coordinate: the parabola has its vertex at (3,7).
Example Graph the quadratic function f (x)=-x2+6x -. Step 3 Find the x-intercepts.Replace f(x) with 0 in f(x)=-x2+ 6x - 2. 0 = -x2+ 6x - 2
Example Graph the quadratic function f (x)=-x2+6x -. Step 4 Find the y-intercept. Replace xwith 0 in f(x)=-x2+ 6x - 2. f(0) =-02+ 6 • 0 - 2=- The y-intercept is –2.The parabola passes through (0, -2). Step 5 Graph the parabola.
Minimum and Maximum: Quadratic Functions • Consider f(x) = ax2 + bx +c. • If a > 0, then f has a minimum that occurs at x = -b/(2a). This minimum value is f(-b/(2a)). • If a < 0, the f has a maximum that occurs at x = -b/(2a). This maximum value is f(-b/(2a)).
Strategy for Solving Problems Involving Maximizing or Minimizing Quadratic Functions • Read the problem carefully and decide which quantity is to be maximized or minimized. • Use the conditions of the problem to express the quantity as a function in one variable. • Rewrite the function in the form f(x) = ax2 + bx +c. • Calculate -b/(2a). If a > 0, then f has a minimum that occurs at x = -b/(2a). This minimum value is f(-b/(2a)). If a < 0, the f has a maximum that occurs at x = -b/(2a). This maximum value is f(-b/(2a)). • Answer the question posed in the problem.