Download

1 / 33
330 likes | 499 Views
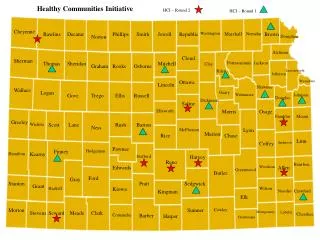
Matthew Flynn (860) 633-4119 x8764 Matt.Flynn@sas.com. The Cotor Challenge, Round 2. A little EDA … Proc GCHART; The data are dominated by single large claim, dashed horizontal lines are at the 95% and 99% percentiles. $10M. $5M. 99 th pctile. 95 th pctile.

E N D
Matthew Flynn (860) 633-4119 x8764 Matt.Flynn@sas.com The Cotor Challenge, Round 2
A little EDA … Proc GCHART;The data are dominated by single large claim, dashed horizontal lines are at the 95% and 99% percentiles $10M $5M 99th pctile 95th pctile
A little EDA … Proc BOXPLOTThe data are dominated by single large claim
A little EDA … Proc UNIVARIATE; Loss Histogram – very, very long tail
A little EDA … Proc UNIVARIATE; Losses verses Exponential distribution Large loss (upper right)
A little EDA continued … Proc UNIVARIATE - logLoss; overall fits are unlikely to fit tails well.
A little EDA … Proc GCHART;The data are dominated by single large claim, vertical lines are at $5m and $10m
A little EDA continued… - logLoss;Top loss = 60% of total dollars, 90% of all dollars are in the top 25 (or 1%) losses
Sample Mean Excess Distribution The sample mean excess distribution is the sum of the excesses over the threshold u divided by the number of data points, n − k + 1, which exceed the threshold u. The sample mean excess function describes the expected excess of a threshold given that exceedance occurs and is an empirical estimate of the mean excess function; e(u) = E [x − u|x > u]. If a graph of the sample mean excess function is horizontal, the tail is exponential. An upward sloping graph is said to be ‘fat-tailed’, relative to an exponential.
Extreme Value Theory – “Peaks Over Threshold” and the Generalized Pareto distribution Next, fitting A GPD fit the tail of the loss distribution via SAS Proc NLMIXED. proc nlmixed data=Cotor(where=(logLoss>11.9)); parms sigma=1 xi=0.3; bounds sigma >= 0; if (1 + xi * ((logLoss – 11.9) / sigma)) <= 0 then lnlike = 11.9 ** 6; else lnlike = -log(sigma) - (1 + (1 / xi))*log(1 + xi * ((logLoss – 11.9) / sigma)); model logLoss ~ general(lnlike); run;
Quantile or Tail Estimator – VaR (Value at Risk) See: McNeil, Alexander J. The Peaks over Thresholds Method for Estimating High Quantiles of Loss Distributions, ASTIN Colloquium, 1997, equation 5, page 10.
Expected Shortfall – Tail VaR – Conditional Tail Expectation If things go bad, how bad is bad? Expected value of a layer from r to R
GPD Model Fit – additional estimates – estimated percentiles, expected shortfall
Sensitivity analysis – expected shortfall, varying size of single largest loss $5M xs $5M layer price estimate $2,364
Bibliography/Resources Beirlant, Jan and Gunther Matthys, G., Heavy Tailed Distributions and Rating, ASTIN Bulletin, 2001, v.31, n.1, p.37-58, http://www.casact.org/library/astin/vol31no1/37.pdf Cebrian, Ana C. , Michel Denuit, and Philippe Lambert, Generalized Pareto Fit to the Society Of Actuaries Large Claims Database, North American Actuarial Journal, 2003, v.7, n.3, p.18-36, http://www.soa.org/bookstore/naaj03_07.html#generalized Chavez-Demoulin, Valerie and Paul Embrechts, Smooth Extremal Models in Finance and Insurance, Journal of Risk and Insurance, 2001, v. 71, n. 2, p. 183-199, http://statwww.epfl.ch/people/chavez/ Coles, Stuart, An Introduction to Statistical Modeling of Extreme Values , Springer, 2001, http://www.maths.bris.ac.uk/~masgc/ismev/summary.html Corradin, Stefano, Economic Risk Capital and Reinsurance: an Application to Fire Claims of an Insurance Company, WP, 2001, http://pascal.iseg.utl.pt/~cemapre/ime2002/main_page/papers/StefanoCorradin.pdf
Bibliography/Resources, cont. Cummins, J. David, Christopher M. Lewis and Richard D. Phillips, Pricing excess-of-loss reinsurance contracts against catastrophic loss, Wharton WP, 1998, n. 98-9, http://fic.wharton.upenn.edu/fic/papers/98/9809.pdf Joossens, Elisabeth and Johan Segers, Modeling large 3rd party claims in car insurance with an extended GPD, WP, June 2004, http://dad.ulyssis.org/~bettie/motorfleet/tekst.pdf McNeil, Alexander J., Estimating the Tails of Loss Severity Distributions using Extreme Value Theory, ASTIN Bulletin, 1997, v. 27, n. 1, p. 117-137, http://www.casact.org/library/astin/vol27no1/117.pdf McNeil, Alexander J., The Peaks over Thresholds Method for Estimating High Quantiles of Loss Distributions, ASTIN Colloquium, 1997
Bibliography/Resources, cont. Reiss, Rolf-Dieter and Michael Thomas , Statistical analysis of extreme values, extended 2nd edition with applications to insurance, finance, hydrology and other fields, Birkhauser, 2001, http://www.xtremes.math.uni-siegen.de/ Smith, Richard L., Statistics of extremes, with applications in environmental science, insurance and finance, U. North Carolina, Statistics WP, July 2002, http://www.stat.unc.edu/postscript/rs/semstatrls.ps See also: SAS Online Docs – Proc NLMIXED
Matt Flynn (860) 633-4119 x8764 Matt.Flynn@sas.com