Download
1 / 10
100 likes | 193 Views
Inspired by Iceland Facebook report October 2011. Summary of the brief. Raise awareness of Iceland as a travel destination during winter season to increase tourism Drive as much traffic to www.inspiredbyiceland.com through paid search channels The channel used is:.

E N D
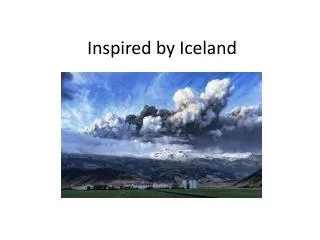
Inspired by Iceland Facebook report October 2011
Summary of the brief • Raise awareness of Iceland as a travel destination during winter season to increase tourism • Drive as much traffic to www.inspiredbyiceland.com through paid search channels • The channel used is:
FacebookCampaign Overview • The Inspired by Iceland Facebook campaign was initially set from October 11th to November 11th2011 with a budget of $ 2.500,- • The budget was increased in mid-air to $ 6.400 and the duration extended to November 30th • The overall outcome of the campaign is: • Campaign reach: 19.538.424 • Fjöldi einstaklinga sem hefur séð aug-lýsingarnar, hver að meðaltali 3,4 sinni • Impressions:67.032.452 • Social reach: 535.375 • Fjöldi þeirra sem sá auglýsingarnará síðum vina sinna sem höfðu smellt • Clicks: 45,896 • Click-Through-Rate (CTR): 0,068% • Average Cost-Per-Click (CPC): $ 0,14 • Average Cost-Per-Mille (CPM) $ 0,09 • Media spend: $6.433.69 (£ 4.100)
FacebookCampaign Performance graph – Clicks New images • The blue line indicates the “Clicks” progress. It visualises the trend of how many people clicked on the Inspired by Iceland ads each day between October 26thand November 22nd • The highest number of clicks per day was 1.366 (14.11.2011)
Facebook Ad Performance • We exchanged two of the images used in the ads and consequently we had a new performer
Campaign summary • We have generated 45,896clicks and 67.032.452impressions, spending $ 6.433,69 • The targeted audience was 350.358.020 users, living in: • The United States, Ireland, Italy, Japan, Mexico, Netherlands, Norway, Canada, Spain, Sweden, Switzerland, United Kingdom, Finland, Denmark, Belgium, Venezuela, Argentina, Australia, Chile, Austria, Russia, Portugal, France or Germany • Age 18 and older
Conclusion • The ad image is decidedly the most important factor • Future initiatives need to be run in separate campaigns for maximum impact vs
Thank you Nordic eMarketing