Download
1 / 16
160 likes | 267 Views
The Effects of Straining on Copper-Silver Hardness. By: Dhanvir Aujla Advisor: Dr. Anthony Rollett Graduate Student: Samuel Lim. Background. To advance the development of magnets, new composites consisting of high strength, and high electrical conductivity properties are needed.

E N D
The Effects of Straining on Copper-Silver Hardness By: Dhanvir AujlaAdvisor: Dr. Anthony RollettGraduate Student: Samuel Lim
Background • To advance the development of magnets, new composites consisting of high strength, and high electrical conductivity properties are needed. • To increase the strength of a material, temperature, impurities, and plastic deformation, are used to influence the materials strength. • These influences also create an increase in resistivity by increasing the number of electron scattering centers, the result can be illustrated by the Mathiessen’s rule as shown below:
The samples used in the following research were comprised of 40% copper and 60% silver. Copper and silver are the two most conductive metals. There are two sets of samples, one, which is cold-worked by a method known as swaging, and the other which is first swaged down to the desired diameter, and then annealed. Background Cont’d
Goals • Improving the current magnets by testing potential composites will lead to creating higher magnetic fields. • Some applications for the higher generated magnetic fields include, efficient power generation, improved magnetic resonance imaging (MRI), and breakthroughs in disease treatments. • My Goals for this summer were to test whether the copper-silver composites will become harder when strained and reduced to a smaller diameters. • The results of this research will enable one to determine if a silver enriched copper-silver composite is suitable for creating the next generation magnets.
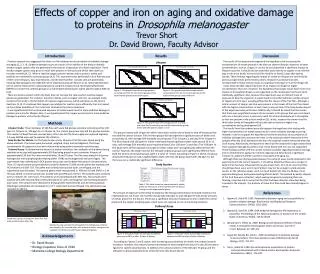
Approach • Preparing the samples • The nano-indenter allowed me to test the hardness across a sample. • The SEM pictures were used to calculate the lamellae thickness. Secondary electrons (2.63mm) Backscattering electrons (2.63mm)
Results • SEM pictures were taken at different magnitudes and were then used to measure the lamellae thickness using the line intercept method. • As the diameter of the samples decrease, so does the thickness, which contributes to the yield stress of the material, illustrated by the Hall-Petch equation.
Hall-Petch equation: Where: = yield stress = friction stress = locking parameter D = grain diameter Taking the experimental Young’s modulus of Copper-Silver to be 88 GPa, and solving for the stress using: One is able to graph the calculated stress vs. the diameter of the grains (D^1/2), to yield the theoretical friction stress and locking parameter, which correspond to the intercept and slope respectively.
The friction stress and locking parameter for the annealed samples are 70.685 GPa and 159.48(N/m)(3/2) respectively. • The friction stress and locking parameter for the as swaged samples are 65.317 GPa and 167.57(N/m)(3/2) respectively.
As the diameter of the material increases, the yield stress decreases. • This correlation can also conclude that if the yield stress decreases as the diameter increases, the hardness must also decrease as the diameter increases.
The hardness for the annealed and as swaged values are relatively the same, and show a trend to increase in hardness as the diameters decrease. However, at larger diameters the values are quite different.
References • Callister, William D. Jr. Material Science and Engineering an Introduction sixth edition, Wiley Inc. • Dieter, George E. Mechanical Metallurgy third edition, McGraw-Hill Inc. 1986 • Heringhaus, Frank. “Quantitative Analysis of the Influence of the Microstructure on Strength, Resistivity, and Magnetoresistance of Eutectic Silver-Copper.” Shaker Verlag, Aachen, 1998 • National High Magnetic Field Laboratory (NHMFL) http://www.magnet.fsu.edu
Acknowledgements • Dr. Rollett • Samuel Lim • Charney Davy • Dr. Kalu Questions?
Annealed (mm) Thickness (microns) As Swaged (mm) Thickness (microns) 13.25 4.77 13.25 4.41 9.25 2.84 9.25 2.92 2.70 0.26 2.70 0.27 2.63 0.22 2.63 0.24 Lamellae thickness
Diameter As Swaged Std. Dev. Annealed Std. Dev. 13.25mm 2.154 GPa 0.263 0.153 GPa 0.068 9.25mm 1.784 GPa 0.15 1.802 GPa 0.235 2.70mm 2.24 GPa 0.1339 2.3 GPa 0.1782 2.63mm 2.15 GPa 0.1003 1.93 GPa 0.1863 Mean Hardness Values