Download
1 / 47
470 likes | 482 Views
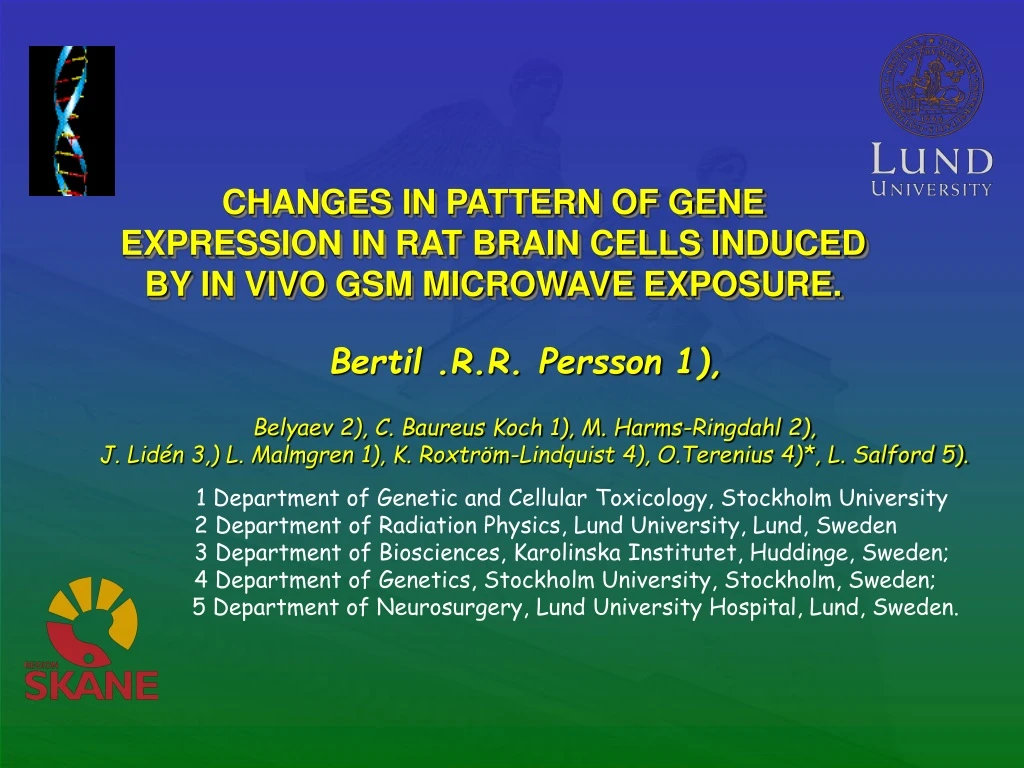
CHANGES IN PATTERN OF GENE EXPRESSION IN RAT BRAIN CELLS INDUCED BY IN VIVO GSM MICROWAVE EXPOSURE. Bertil .R.R. Persson 1),. Belyaev 2), C. Baureus Koch 1), M. Harms-Ringdahl 2), J. Lidén 3,) L. Malmgren 1), K. Roxtröm-Lindquist 4), O.Terenius 4)*, L. Salford 5).

E N D
CHANGES IN PATTERN OF GENE EXPRESSION IN RAT BRAIN CELLS INDUCED BY IN VIVO GSM MICROWAVE EXPOSURE. Bertil .R.R. Persson 1), Belyaev 2), C. Baureus Koch 1), M. Harms-Ringdahl 2), J. Lidén 3,) L. Malmgren 1), K. Roxtröm-Lindquist 4), O.Terenius 4)*, L. Salford 5). 1 Department of Genetic and Cellular Toxicology, Stockholm University 2 Department of Radiation Physics, Lund University, Lund, Sweden 3 Department of Biosciences, Karolinska Institutet, Huddinge, Sweden; 4 Department of Genetics, Stockholm University, Stockholm, Sweden; 5 Department of Neurosurgery, Lund University Hospital, Lund, Sweden.
Biological effects of microwaves • depend on several physical parameters of exposure • frequency, • modulation, • polarization • intensity (Adey 1999; Belyaev, et al. 2000) Bertil.Persson@radfys.lu.se
Health-related effects of microwaves • In previous studies we have investigated how low intensity GSM modulated microwaves effects: • Leakage in brain blood barrier (Persson et al. 1997) • Activity of ODC and levels of polyamines in • tissues of rats and mice (Persson et al. 2000) • Dead Neurons (Salford et al 2003) • In the present work we have studied whether low intensity GSM modulated microwaves • induce DNA breaks, • change chromatin conformation • change gene expression. Bertil.Persson@radfys.lu.se
Objectives • Here, we investigated whether Global System for Mobile Communication (GSM) microwaves induce DNA breaks, changes in chromatin conformation and in gene expression. Bertil.Persson@radfys.lu.se
GSM microwaves Real GSM microwave signal under controlled frequency and power level This installation is based on a GSM900 test-mobile phone The output of the test-mobile phone is connected by coaxial cable to transverse electromagnetic cell (TEM-cell). Construction of the TEM-cell allows relatively homogeneous exposure of samples The test-mobile phone is programmed to choose any pre-set channel from a nearest base station. There are 124 different channels/frequencies, which are used in GSM900 mobile communication. They differ by 0.2 MHz in the frequency range between 890.2 MHz and 915 MHz. Frequency is supplied by chance to mobile phone users. Our installation gives a possibility to select a pre-set frequency. This signal includes standard GSM modulation. The test phone has also a programmed regulation of output power in the range of 0.02-2 W (13-33 dBm). This power was kept constant during exposure as monitored on-line using a sensitive detector, which was calibrated with a power meter. SAR (specific absorbed rate) was 0.4 mW/g. Bertil.Persson@radfys.lu.se
Exposure A GSM test phone had a programmed regulation of output power in the range of 0.02 - 2 W (13-33 dBm). We used maximum output power level, 2 W, which corresponds to SAR being 400 mW/kg. Rats, 4 animals in each group, were exposed or sham-exposed in parallel, in couples, to microwaves during 2 h. Bertil.Persson@radfys.lu.se
Directional coupler Circulator Diode detector TEM- cell Dummy Load Connected to an oscilloscope for on-line monitoring of the output power. Test phone Dummy Load Installation for GSM exposure Bertil.Persson@radfys.lu.se
Analysis After exposure, rats were sacrificed and brains were dissected into gray matter and white matter. Cell suspensions were prepared from these samples, as well as from spleen and thymus. Small brains were frozen in “RNAlater” for extraction of RNA and analysis ofgene expression patterns. Bertil.Persson@radfys.lu.se
Changes in chromatin conformation The changes in chromatin conformation, which are indicative of stress response, were measured with the method of anomalous viscosity time dependencies (AVTD) in extracts of rat brains. No effects of GSM exposure was observed on conformation of chromatin as studied by the AVTD method. Bertil.Persson@radfys.lu.se
DNA DSBs were analyzed by pulsed-field gel electrophoresis (PFGE). No microwave-induced DNA double strand breaks were detected using PFGE in all four types of cells. Bertil.Persson@radfys.lu.se
Level of mRNA expression The level of mRNA expression was studied by gene microarrays using copy-DNA and Affymetrix U34 GeneChips representing 8800 genes. The data were analyzed with the t-test and the Affymetrix Microarray Suite (MAS) 5.0 software. Bertil.Persson@radfys.lu.se
As portrayed to the left for each oligonucleotide there are multiple repeats and corresponding mismatches. In a perfect world the RNA of Gene X will hybridise avidly to its perfect match but will not hybridise at all to the corresponding mismatch. Any fluorescence that is found in the MM tiles is deemed as non-specific hybridisation and therefore a simple correction of the data can be made by merely subtracting the control (MM) from the experimental intensity (PM) for each probe pair. Bertil.Persson@radfys.lu.se
Red: Green: The false-color image that combines the red and green signals into a single image: Bertil.Persson@radfys.lu.se
The average difference for a particular probe set is then defined as the mean of all the (PM-MM) differences. The resulting value, or absolute expression value, is then taken as proportional to the actual amount of RNA of the corresponding gene in the sample. So an average difference value is calculated for each probe set (i.e. each gene). Hence a representative table can be drawn such that the average difference values are shown: This can be tabulated into a tab-delimited text file. The codes under the Affy header are probe set codes. Translations of the codes can be done on the NettAffx (Affymetrix) website, After normalisation one can go ahead with analysis as explained earlier just the same as one would with cDNA arrays. To compare two RNA sources (e.g. exposed and non-exposed) one would have to perform 2 GeneChips (one for each RNA source) and working out the ratios for a particular gene. Bertil.Persson@radfys.lu.se
The array (termed GeneChip by Affymetrix) is made up of • thousands of tiles with tethered nucleotides (tiles are sometimes, • confusingly, called cells). • A single gene is represented by adjacent tiles 16 to 24 times (i.e. • each tile has tethered oligonuceotide), depending on the type of • array - this serves as an internal repeat for each hybridisation. • For each of these tiles (oligonucleotide is a Perfect Match, PM – • positive probe) there are the same number of adjacent tiles that are • Mismatches (MM - negative probe). • This therefore makes up a number of probe pairs as an internal • control. The PMs and MMs for a single gene is collectively termed • as a probe set. Bertil.Persson@radfys.lu.se
Each image is about 8 megabytes in size, we have taken the full data sets, initially 16-bit TIFF files, and converted them to 8-bit JPG files. The compression routines for JPG images are better, so the files have shrunk from 8.1M apiece to about 0.5-0.7M apiece. You can view the large images here. Red channel Green channel Bertil.Persson@radfys.lu.se
Data analysis output: Affymetrix Microarray Suite (MAS) 5.0 software Detection (P,M,A) Signal Change (I, D, NC) Signal Log Ratio Bertil.Persson@radfys.lu.se
Change in gene expression. Six samples from exposed and sham exposed groups, 3 versus 3, were selected for microarray analysis based on RNA quality control. Eleven genes were up regulated in all exposed animals and one gene was down regulated. These changes were statistically significant in all 9 comparisons. Bertil.Persson@radfys.lu.se
Change in gene expressionof importance forBlood Brain Barrier (BBB) function 2 genes were up regulated (7 and 10) Bertil.Persson@radfys.lu.se
Gene response to 914.8 MHz GSM, p<0.0025 (3) BBB function Bertil.Persson@radfys.lu.se
GSM upregulated gene 7 GenBank number:M96601_at Fold increase:1.56 0.23 Gene title:Solute carrier family 6, member 6 Gene symbol rat:SLC6A6 Function:Taurine transporter. Predominantly glial expression. Role in BBB function Bertil.Persson@radfys.lu.se
GSM upregulated gene 10 GenBank number:rc_AA800851_s_at Fold increase: 1.33 0.20 Gene title:Carboxylesterase 3 Gene symbol rat:Ces3 Function:Expressed in endothelial cells of the brain. Role in BBB function Bertil.Persson@radfys.lu.se
Change in gene expressionof importance forMetabolic enzymes 2 genes were up regulated (11 and 4) and one gene was down regulated. Bertil.Persson@radfys.lu.se
Gene response to 914.8 MHz GSM, p<0.0025 (1) Metabolic enzymes Bertil.Persson@radfys.lu.se
GSM upregulated gene 11 GenBank number:rc_AI014135_g_at Fold increase:2.74 1.13 Gene name:beta carotene15, 15-dioxygenase Gene symbol rat:Bcdo Function:Vitamin A metabolism. Involved in reaction to oxidation stress Bertil.Persson@radfys.lu.se
GSM upregulated gene 4 GenBank number: J03481 mRNA_at Fold increase: 1.64 0.37 Gene title: Quinoid dihydropteridine reductase Gene symbol rat: Qdpr Function:Metabolism: Cofactor in the enzymatic hydroxylation Bertil.Persson@radfys.lu.se
GSM downregulated gene GenBank number:U01344_g_at Fold change:0.48 13 Gene name:N-acetyltransferas 1 Gene symbol rat:Nat1 Function:Metabolic enzyme: A key role in the circadian rhythm of melatonin synthesis. Carcinogen metabolism, neurotransmission, and hormonal regulation Bertil.Persson@radfys.lu.se
Change in gene expressionof importance for Glia function 3 genes were up regulated (8,2 and 1) Bertil.Persson@radfys.lu.se
Gene response to 914.8 MHz GSM, p<0.0025 (2) Glia function Bertil.Persson@radfys.lu.se
GSM upregulated gene 8 GenBank number: M22357_at Fold increase: 1.88 0.51 Gene title: Myelin associated glycoprotein Gene symbol rat: Mag Function: The myelin-associated glycoprotein, a member of the immunoglobulin superfamily. Interaction between myelinating cells and axons. Formation and maintenance of periaxonal space. Formation of the myelin sheath during development. Involved in glia-neuron interaction Bertil.Persson@radfys.lu.se
GSM upregulated gene 2 GenBank number; AF030358_g_at Fold increase: 1.61 0.26 Gene name: Fractalkine (chemokine 3X3C) Gene symbol rat:Cx3cl1 Function:Activation and chemo attraction of microglia into infarcted tissue Bertil.Persson@radfys.lu.se
GSM upregulated gene 1 GenBank number: A03913cds_s_at Fold increase:1.40 0.11 Gene title: Serpine-2 Gene symbol rat: GDN_RAS Function: Serine protease inhibitor. Glia-derived nexin-precursor. Involved in synaptic plasticity Bertil.Persson@radfys.lu.se
Change in gene expressionof importance forMiscellaneous 4 genes were up regulated (3,5,6 and 9) Bertil.Persson@radfys.lu.se
Gene response to 914.8 MHz GSM, p<0.0025 (4) Bertil.Persson@radfys.lu.se
GSM upregulated gene 3 GenBank number; AF036548_at Fold increase: 1.91 0.67 Gene title: Rgc32 protein Gene symbol rat: RGC-32 Function: Cell cycle regulatory factor Bertil.Persson@radfys.lu.se
GSM upregulated gene 5 GenBank number:L13619_g_at Fold increase:1.81 0.74 Gene title:Insulin induced growth hormone response protein CL-6 (Insig-1) Gene symbol rat: ISI1_RAT Function:Key regulator of cholesterol biosynthesis by interaction with HMG-CoA synthetase. The most highly insulin induced gene in liver Bertil.Persson@radfys.lu.se
GSM upregulated gene 6 GenBank number:M27207mRNA_s_at Fold increase:1.62 0.22 Gene title:Collagen alpha 1 (I)- - Gene symbol mouse:Colla1 Function:Extra cellular matrix structural protein. Its expression is regulated after sciatic nerve injury Bertil.Persson@radfys.lu.se
GSM upregulated gene 9 GenBank number:rc_AA799542_at Fold increase:1.58 0.28 Gene name:Ras-related C3 butulinum toxine substrate 1 Gene symbol mouse:Rac 3 Function:Member of the RAS superfamily of small GTP-binding protein involved in signal transduction Bertil.Persson@radfys.lu.se
Conclusions • The data showed that GSM microwaves affected expression of genes in rat brain under specific conditions of exposure but did not induce DNA breaks and changes in chromatin conformation. Acknowledgements These studies were supported by the Swedish Council for Working Life and Social Research, and the Swedish Radiation Protection Authority Bertil.Persson@radfys.lu.se
Anomalous viscosity time dependence (AVTD) measure relaxation and condensation of DNA loops AVTD measuresrelaxation or condensation of DNA loops in human lymphocytes upon treatment with different concentrations of ethidium bromide, EtBr Bertil.Persson@radfys.lu.se
No effects of GSM exposure on conformation of chromatin, AVTD Bertil.Persson@radfys.lu.se
Despite of individual variability, condensation of chromatin was characteristic response to both ELF 50 Hz and GSM microwaves Bertil.Persson@radfys.lu.se
No microwave-induced DNA DSBs were detected using PFGE Bertil.Persson@radfys.lu.se