Download
1 / 4
40 likes | 65 Views
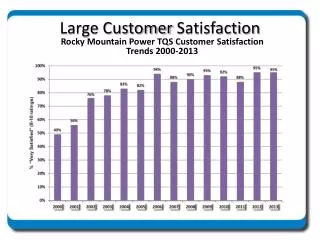
ISDS Service Support Performance – August 2019. Customer Satisfaction. Ticket Volumes by Channel. First Contact Resolution. Incident Response. Incident Resolution. Change Success Rate. Incident Response. Aug-19 satisfaction: 96% Aug-19 responses: 96 12-month average: 97%.

E N D
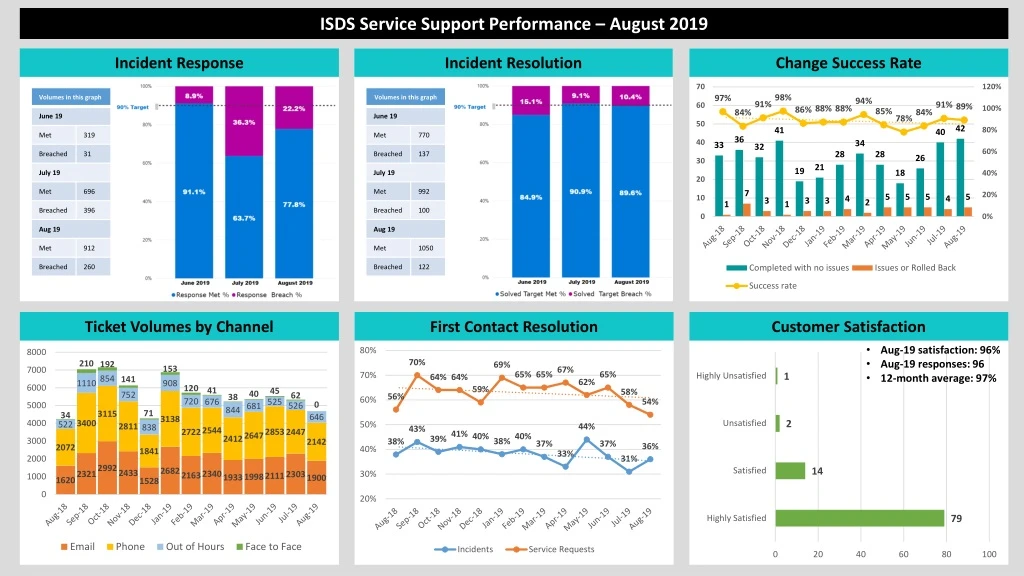
ISDS Service Support Performance – August 2019 Customer Satisfaction Ticket Volumes by Channel First Contact Resolution Incident Response Incident Resolution Change Success Rate Incident Response • Aug-19 satisfaction: 96% • Aug-19 responses: 96 • 12-month average: 97%
ISDS Service Support Performance Dashboard Explained Incident Response Ticket Volumes by Channel First Contact Resolution Customer Satisfaction Incident Resolution Change Success Rate Description: Time to resolve an incident, based on the following targets: Calculation: All ISDS teams (including Service Desk) and all priorities combined total, showing whether we met or breached the agreed targets for the last 3 months. Comments and data observations: Despite our time to Respond to tickets being low, our Resolve SLA is closer to our target. This means that the customer experience was not overly affected by the slow Response time. As a priority we will seek to return our Resolve rate to being consistently above 90%. Description: Time to assign an incident to a technician, based on the following targets: Calculation: All ISDS teams (from July 2019, including the Service Desk) and all priorities combined total, showing whether we met or breached the agreed targets for the last 3 months. Comments and data observations:Response has recovered slightly from July but is still below target: we are continuing to address the primary causes of this. In particular, how we can best manage the large number of email tickets that currently breach their response whilst waiting in the Helpline’s queue. Description: 13-month high level view of whether IT changes have been performed with no issues, some issues or major issues. The categorisation is based on the following info: Comments and data observations: 42 completed with no issues and 5 with issues for a success rate of 89%. Note: Success rate % only includes changes completed with NO issues out of total number of changes attempted. Excludes Pre-Authorised Changes prior to August 2019. Description: Responses to our on-going customer satisfaction survey at the end of each ticket resolution. Excludes face to face feedback cards. Calculation: The number of customers who responded with either highly satisfied or satisfied, versus the number of customers who responded with unsatisfied or highly unsatisfied. Includes feedback for all ISDS teams. Comments and data observations: All feedback received for Cherwell tickets is analysed and shared with the relevant teams each month. Customers who were unsatisfied are contacted by the responsible team or the Service Management Office. Description: 13-month view of the total number of cases in our ITSM tool, processed by the IT Helpline per month, per channel. Calculation: Includes all incidents, service requests and requests for information, and cases recorded by NorMAN (our Out of Hours service). Comments and data observations: The Service Desk processed 4738 cases during the month of August. This is 490 more cases than in August 2019; representing an increase across all channels year-on-year, with the exception of face-to-face which was not run during August 2019. Description: 13-month view of Incidents versus Service Requests resolved by the Service Desk at first contact. Calculation: Includes only incidents and service requests. Calculated as cases logged via phone or face-to-face and marked as resolved in our ITSM tool within 20 minutes of being logged. Excludes emails. Comments and data observations: Total FCR was 48%. This is equal to July 2019 however shows we have recovered from June where changing ITSM tools caused a noticeable decline. We continue to work with technical teams to increase FCR on a long-term basis through Shift Left initiatives.
ISDS Service Level Overview – Critical Services – August 2019
ISDS Service Level Performance Explained • Availability and reliability reporting explained: • Only Business Critical services are included in the report • Measured & reported monthly, calculated on a 24/7 basis • Any downtime approved in advance via the IT Change Management process is excluded from these calculations • Downtime is recorded and reported manually, i.e. not via an automated monitoring system • Availability and reliability comments and data observations: • Work to produce a service catalogue is ongoing to define components of Business Critical services to help clarify uptime/downtime. • Outside of the Critical Services, Printing has also suffered several short periods of unavailability. Given the time of the year these did not produce many Incidents, and a Problem Record has been logged. A fix has been applied and we are monitoring for reoccurrences.