Download
1 / 23
330 likes | 585 Views
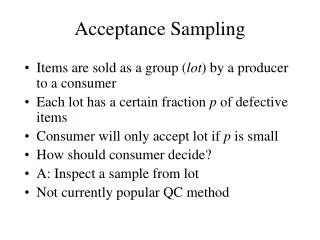
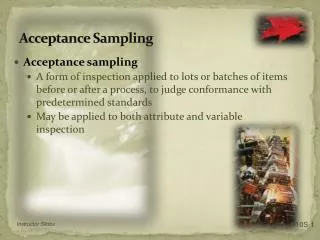
Lesson 15 Acceptance Sampling. a form of inspection applied to lots or batches of items before or after a process to judge conformance to predetermined standards. . Destructive testing is required. Acceptance Sampling. Acceptance Sampling is very useful when

E N D
Lesson 15 Acceptance Sampling a form of inspection applied to lots or batches of items before or after a process to judge conformance to predetermined standards
. Destructive testing is required Acceptance Sampling Acceptance Sampling is very useful when . Large numbers of items must be processed in a short amount of time . The cost of “passing defectives” is low . Fatigue/boredom is caused by inspecting large numbers of items
Lot Random sample Sampling Plans Sampling Plans specify the lot size, sample size, number of samples and acceptance/rejection criteria. Sampling plans involve . Single sampling . Double sampling . Multiple sampling
Lot (N items) Random sample (n items) Lot (N items) Random sample (n items) Single Sampling Plan A Single Sampling Plan is one where . A representative sample of n items is drawn from a lot size of N items. . Each item in the sample is examined and classified as good/defective . If the number of defective exceeds a specified rejection number (C - cut off point) the whole lot is rejected; otherwise the whole lot is accepted
Double Sampling Plan A Double Sampling Plan allows the opportunity to take a second sample if the results of the original sample are inconclusive. . Specifies the lot size, size of the initial sample, the accept/reject/inconclusive criteria for the initial sample (CL - lower level of defectives, CU - upper level of defectives) . Specifies the size of the second sample and the acceptance rejection criteria based on the total number of defective observed in both the first and second sample (CT- total allowable defectives) It works like the following example
Double Sampling Plan Lot First Random sample First sample inconclusive, take second sample Accept Lot Reject Lot CL CU Compare number of defective found in the first random sample toCLandCUand make appropriate decision.
Lot First Random sample Second Random sample Double Sampling Plan Accept Lot Reject Lot CT Compare the total number of defective in both lots to CT and make the appropriate decision
Multiple Sampling Plan A Multiple Sampling Plan is similar to the double sampling plan in that successive trials are made, each of which has acceptance, rejection and inconclusive options. Which Plan you choose depends on . Cost and time . Number of samples needed and number of items in each sample
Acceptance Sampling Purposes Determine quality level Ensure quality is within predetermined level Advantages Economy Less handling damage Fewer inspectors Upgrading of the inspection job Applicability to destructive testing Entire lot rejection (motivation for improvement) Disadvantages Risks of accepting “bad” lots and rejecting “good” lots Added planning and documentation Sample provides less information than 100-percent inspection
Under this sampling plan, if the lot has 3% defective . the probability of accepting the lot is 90% . the probability of rejecting the lot is 10% If the lot has 20% defective . it has a small probability (5%) of being accepted . the probability of rejecting the lot is 95% Operating Characteristic Curve (OCC) An Operating Characteristic Curve (OCC) is a probability curve for a sampling plan that shows the probabilities of accepting lots with various lot quality levels (% defectives). 1 0.9 0.8 0.7 0.6 0.5 Probability of accepting lot 0.4 0.3 0.2 0.1 0 Lot quality (% defective) 0 .05 .10 .15 .20
Approximately 80% This sampling plan may not be acceptable to customer. Therefore, this sampling plan may not be acceptable for meeting the customers level of quality. Operating Characteristic Curve (OCC) Under this sampling plan what is the probability of accepting a lot that has 5% defectives? 1 0.9 0.8 0.7 0.6 0.5 Probability of accepting lot 0.4 0.3 0.2 0.1 0 Lot quality (% defective) 0 .10 .15 .20 .05
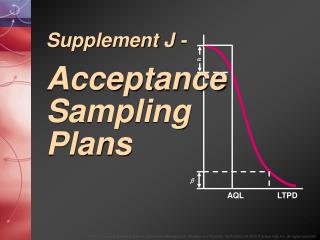
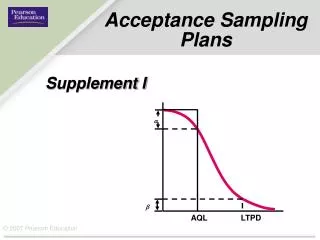
Customer Acceptance Levels Most customers understand that 100% inspection is impractical and are generally willing to accept that a certain level of defectives will be produced. The Acceptable Quality Level (AQL) is the percentage level of defects at which a customer is willing to accept as lot as “good”. The Lot Tolerance Percent Defective (LTPD) is the upper limit on the percentage of defectives that a customer is willing to accept. Customers want lots with quality better than or equal to the AQL but are willing to live with some lots with quality as poor as the LTPD, but prefer not to accept lots with quality levels worse than the LTPD.
Customer Acceptance Levels Therefore the sampling plan must be designed to assure the customer that they will be receiving the required AQL and LTPD. The AQL and LTPD are dependent on many things (reliability, liability, competitor quality levels, etc.) and will vary by industry and by customer. Typically industry standards are set because suppliers have more than one customer and customers have more than one supplier. The Consumer’s Risk is the probability that an unacceptable lot (e.g. above the LTPD) will be accepted. The Producer’s Risk is the probability that a “good” lot will be rejected.
1 Producer’s Risk = probability acceptable lot is rejected 0.9 0.8 0.7 0.6 0.5 AQL - percentage level of defects at which a customer is willing to accept Probability of accepting lot 0.4 0.3 0.2 0.1 0 Lot quality (% defective) 0 .10 .15 .20 .05 “Acceptable Lot” OCC, AQL & Producer’s Risk
1 0.9 0.8 0.7 LTPD - upper limit on the percentage of defectives that a customer is willing to accept. 0.6 0.5 Probability of accepting lot 0.4 0.3 0.2 0.1 Consumer’s Risk = probability unacceptable is accepted 0 Lot quality (% defective) 0 .10 .15 .20 .05 “Unacceptable Lot” OCC, LTPD & Consumer’s Risk
Average Quality Of Inspected Lots The result of acceptance sampling (assuming rejected lots are 100% inspected) is that the level of inspection automatically adjusts to the quality of the lots being inspected. The Average Outgoing Quality (AOQ) is the average of rejected lots (100% inspection) and accepted lots ( a sample of items inspected). The maximum outgoing quality level is referred to as the AOQL.
OCC Example: Create an Operating Characteristic Curve for the sampling plan: Lot Size = N = 2000, sample size = n = 10, reject if number defectives > C = 1. Answer the following questions.
Operating Characteristic Curves What is the probability of accepting a lot which has 2.5% defective?
Operating Characteristic Curves What is the Producer’s risk if the AQL is 1%? .0043 Mouse over the “Producer’s risk” cell to see the explanation.
Operating Characteristic Curves What is the Consumer’s risk if the LTPD is 6%? .8824 Mouse over the “Consumer’s Risk” cell to see the explanation.
Operating Characteristic Curves What is the AOQ curve? What is the AOQL?
Homework Read and understand all material in the chapter. Discussion and Review Questions Recreate and understand all classroom examples Exercises on chapter web page