Download
1 / 49
490 likes | 605 Views
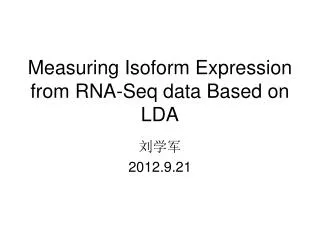
Evaluation of Signaling Cascades Based on the Weights from Microarray and ChIP-seq Data. by Zerrin Işık Volkan Atalay Rengül Çetin-Atalay. Middle East Technical University and Bilkent University Ankara - TURKEY. Content. Analysis of Microarray Data ChIP-Seq Data

E N D
Evaluation of Signaling Cascades Based on theWeights from Microarray and ChIP-seq Data by Zerrin Işık Volkan Atalay Rengül Çetin-Atalay Middle East Technical University and Bilkent University Ankara - TURKEY
Content • Analysis of Microarray Data • ChIP-Seq Data • Data Processing & Integration • Scoring of Signaling Cascades • Results
Traditional Analysis of Microarray Data Array2BIO BMC Bioinf. 2006
Tissuearray Proteomics Microarray Expression, Function, Interaction data Data Acquisition Integration Analysis Protein Databases Scientific Literature Traditional Analysis of Microarray Data ChIP-Seq
Traditional Analysis of Microarray Data http://www.biomarker.emory.edu/equipment.php
Traditional Analysis of Microarray Data These tools dependonthe primary significant gene lists!
Content • Analysis of Microarray Data • ChIP-Seq Data • Data Processing & Integration • Scoring of Signaling Cascades • Results
Chromatin ImmunoPrecipitation http://www.bioinforx.com
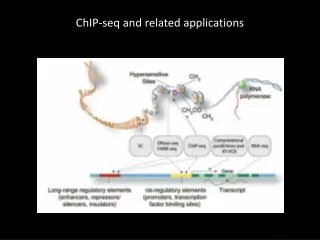
ChIP-Sequencing • Chromatin Immunoprecipitation (ChIP) combined with genome re-sequencing (ChIP-seq) technology provides protein DNA interactome data. • Generally, ChIP-seq experiments are designed for target transcription factors to provide their genome-wide binding information.
Analysis of ChIP-seq Data • Several analysis tools avaliable: • QuEST: peak region detection • SISSRs : peak region detection • CisGenome: system to analyse ChIP data • visualization • data normalization • peak detection • FDR computation • gene-peak association • sequence and motif analysis
Analysis Steps of ChIP-seq Data • Alignreads to the reference genome. 1:17:900:850 AGAACTTGGTGGTCATGGTGGAAGGGAG U1010chr2.fa9391175F..19A
Analysis Steps of ChIP-seq Data • Identification of peak (binding) regions. • Peak: Region has high sequencing read density • FDR computation of peak regions. • Sequence and motif analysis.
Further Analysis of ChIP-Seq Data • Although there are a few number of early stage analysis tools for ChIP-seq data,gene annotation methods should also be integrated like in the case ofmicroarray data analysis. • ChIP-seq experiments provide detailed knowledge about target genesto predict pathway activities.
Content • Analysis of Microarray Data • ChIP-Seq Data • Data Processing & Integration • Scoring of Signaling Cascades • Results
Data Set • ChIP-Seq Data: OCT1 (TF) • Kang et.al. Genes Dev. 2009 (GSE14283) • Performed on human HeLa S3 cells. • Identify the genes targeted by OCT1 TF under conditions of oxidative stress. • Microarray Data: • Murray et.al. Mol BiolCel. 2004 (GSE4301) • 12800 human genes. • oxidative stress applied two channel data.
Analysis of Raw ChIP-Seq Data CisGenome software identified peak regions of OCT1 data. 3.8 million reads 5080 peak regions
Analysis of Raw ChIP-Seq Data Identify neighboring genes of peak regions. - 10000 bp ←.→ 10000 bp +
Analysis of Raw ChIP-Seq Data TSS 5'UTR
ChIP-Seq Data Ranking Percentile rank of each peak region is computed: cfl: cumulative frequency for all scores lower than score of the peak region r fr: frequency of score of peak region r T: the total number of peak regions
Microarray Data Analysis • Two channel data • Use limma package of R-Bioconductor • Apply background correction • Normalize data between arrays • Compute fold-change of gene x :
Microarray Data Ranking Set a percentile rank value for each gene : cfl: cumulative frequency for all fold-change values lower than the fold - change of the gene x fx: frequency of the fold-change of the gene x T: the total number of genes in chip
Integration of ChIP-Seq and Microarray Data Scores wereassociatedby taking their weighted linear combinations.
Integration of ChIP-Seq and Microarray Data Scores wereassociatedby taking their weighted linear combinations.
Content • Analysis of Microarray Data • ChIP-Seq Data • Data Processing & Integration • Scoring of Signaling Cascades • Results
Scoring of Signaling Cascades • KEGG pathways were used as the model to identify signaling cascades under the control of specificbiological processes. • Each signaling cascade was convertedinto a graph structure by extracting KGML files.
KGML example <entry id="11" name="hsa:1154" type="gene" link=http://www.genome.jp/dbget-bin/www_bget?hsa+1154> <graphics name="CISH" fgcolor="#000000" bgcolor="#BFFFBF" type="rectangle" x="802" y="283" width="46" height="17"/> </entry> <entry id="16" name="hsa:6772" type="gene" link=http://www.genome.jp/dbget-bin/www_bget?hsa+6772> <graphics name="STAT1..." fgcolor="#000000" bgcolor="#BFFFBF" type="rectangle" x="343" y="246" width="46" height="17"/> </entry> <entry id="21" name="hsa:3716" type="gene" link=http://www.genome.jp/dbget-bin/www_bget?hsa+3716> <graphics name="JAK1..." fgcolor="#000000" bgcolor="#BFFFBF" type="rectangle" x="208" y="246" width="46" height="17"/> </entry> <relation entry1="21" entry2="16" type="PPrel“><subtype name="phosphorylation" value="+p"/> </relation> <relation entry1="11" entry2="16" type="PPrel“><subtype name="inhibition" value="--|"/> </relation>
KGML example <entry id="11" name="hsa:1154" type="gene" link=http://www.genome.jp/dbget-bin/www_bget?hsa+1154> <graphics name="CISH" fgcolor="#000000" bgcolor="#BFFFBF" type="rectangle" x="802" y="283" width="46" height="17"/> </entry> <entry id="16" name="hsa:6772" type="gene" link=http://www.genome.jp/dbget-bin/www_bget?hsa+6772> <graphics name="STAT1..." fgcolor="#000000" bgcolor="#BFFFBF" type="rectangle" x="343" y="246" width="46" height="17"/> </entry> <entry id="21" name="hsa:3716" type="gene" link=http://www.genome.jp/dbget-bin/www_bget?hsa+3716> <graphics name="JAK1..." fgcolor="#000000" bgcolor="#BFFFBF" type="rectangle" x="208" y="246" width="46" height="17"/> </entry> <relation entry1="21" entry2="16" type="PPrel“><subtype name="phosphorylation" value="+p"/> </relation> <relation entry1="11" entry2="16" type="PPrel“><subtype name="inhibition" value="--|"/> </relation> +p JAK1 STAT1 CISH
Content • Analysis of Microarray Data • ChIP-Seq Data • Data Processing & Integration • Scoring of Signaling Cascades • Results
Evaluated Signaling Cascades • Jak-STAT • TGF-β • Apoptosis • MAPK
Evaluated Signaling Cascades Apoptosis Cell cycle MAPK Ubiquitin mediated proteolysis • Jak-STAT • TGF-β • Apoptosis • MAPK Apoptosis Cell cycle MAPK Survival Apoptosis Degradation Apoptosis Cell cycle p53 signaling Wnt signaling Proliferation and differentiation
Oxidative stress Control data
Discussion • The scores obtained with control experiment are lower compared to oxidative stress scores. • The most effected biological process under oxidative stress condition and transcription of OCT1 protein was Apoptosisprocess having the highest score between signaling cascades. • Biologist should perform lab experiment to validate this cause and effect relation.
Conclusion • Our hybrid approach integrates large scale transcriptome datato quantitatively assess the weight of a signaling cascade under the control ofa biological process. • Signaling cascades in KEGG database were used as the models of the approach. • The framework can be applicable to directed acyclic graphs.
Future Work • Different ranking methods on the transcriptome data will be analyzed. • In order to provide comparable scores on signaling cascades, score computation method will be changed. • Permutation tests will be included to provide significance levels for enrichment scores of signaling cascades.
Acknowledgement • My colleagues: • Prof.Dr. Volkan Atalay • Assoc. Prof. MD. Rengül Çetin-Atalay • Sharing their raw ChIP-seq data: • Assist. Prof. Dr. Dean Tantin • Travel support: • The Scientific and Technological Research Council of Turkey (TÜBİTAK)
Evaluation of Signaling Cascades Based on theWeights from Microarray and ChIP-seq Data Zerrin Işık, Volkan Atalay, and Rengül Çetin-Atalay Middle East Technical University and Bilkent University Ankara - TURKEY