Download
1 / 1
10 likes | 130 Views
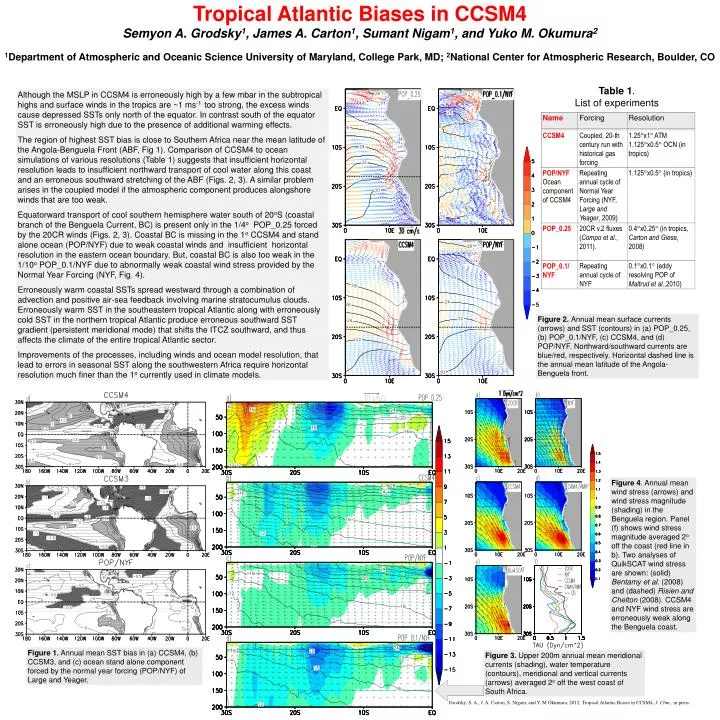
Tropical Atlantic Biases in CCSM4 Semyon A. Grodsky 1 , James A. Carton 1 , Sumant Nigam 1 , and Yuko M. Okumura 2 1 Department of Atmospheric and Oceanic Science University of Maryland, College Park, MD; 2 National Center for Atmospheric Research, Boulder, CO. Table 1 . List of experiments.

E N D
Tropical Atlantic Biases in CCSM4 Semyon A. Grodsky1, James A. Carton1, Sumant Nigam1, and Yuko M. Okumura2 1Department of Atmospheric and Oceanic Science University of Maryland, College Park, MD; 2National Center for Atmospheric Research, Boulder, CO Table 1. List of experiments Although the MSLP in CCSM4 is erroneously high by a few mbar in the subtropical highs and surface winds in the tropics are ~1 ms-1 too strong, the excess winds cause depressed SSTs only north of the equator. In contrast south of the equator SST is erroneously high due to the presence of additional warming effects. The region of highest SST bias is close to Southern Africa near the mean latitude of the Angola-Benguela Front (ABF, Fig 1). Comparison of CCSM4 to ocean simulations of various resolutions (Table 1) suggests that insufficient horizontal resolution leads to insufficient northward transport of cool water along this coast and an erroneous southward stretching of the ABF (Figs. 2, 3). A similar problem arises in the coupled model if the atmospheric component produces alongshore winds that are too weak. Equatorward transport of cool southern hemisphere water south of 20oS (coastal branch of the Benguela Current, BC) is present only in the 1/4o POP_0.25 forced by the 20CR winds (Figs. 2, 3). Coastal BC is missing in the 1o CCSM4 and stand alone ocean (POP/NYF) due to weak coastal winds and insufficient horizontal resolution in the eastern ocean boundary. But, coastal BC is also too weak in the 1/10o POP_0.1/NYF due to abnormally weak coastal wind stress provided by the Normal Year Forcing (NYF, Fig. 4). Erroneously warm coastal SSTs spread westward through a combination of advection and positive air-sea feedback involving marine stratocumulus clouds. Erroneously warm SST in the southeastern tropical Atlantic along with erroneously cold SST in the northern tropical Atlantic produce erroneous southward SST gradient (persistent meridional mode) that shifts the ITCZ southward, and thus affects the climate of the entire tropical Atlantic sector. Improvements of the processes, including winds and ocean model resolution, that lead to errors in seasonal SST along the southwestern Africa require horizontal resolution much finer than the 1o currently used in climate models. Figure 2. Annual mean surface currents (arrows) and SST (contours) in (a) POP_0.25, (b) POP_0.1/NYF, (c) CCSM4, and (d) POP/NYF. Northward/southward currents are blue/red, respectively. Horizontal dashed line is the annual mean latitude of the Angola-Benguela front. Figure 4. Annual mean wind stress (arrows) and wind stress magnitude (shading) in the Benguela region. Panel (f) shows wind stress magnitude averaged 2o off the coast (red line in b). Two analyses of QuikSCAT wind stress are shown: (solid) Bentamy et al. (2008) and (dashed) Risien and Chelton (2008). CCSM4 and NYF wind stress are erroneously weak along the Benguela coast. Figure 1. Annual mean SST bias in (a) CCSM4, (b) CCSM3, and (c) ocean stand alone component forced by the normal year forcing (POP/NYF) of Large and Yeager. Figure 3. Upper 200m annual meanmeridional currents (shading), water temperature (contours), meridional and vertical currents (arrows) averaged 2o off the west coast of South Africa. Grodsky, S. A., J. A. Carton, S. Nigam, and Y. M Okumura, 2012: Tropical Atlantic Biases in CCSM4, J. Clim., in press.