Download
1 / 40
400 likes | 628 Views
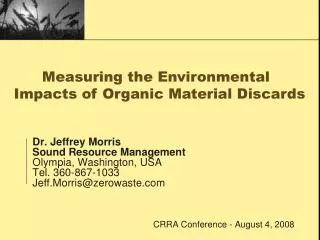
Use of LCA Methods For The Recycling vs. Disposal Issue: Prices & Costs vs. Energy & Environmental Impacts. Dr. Jeffrey Morris Sound Resource Management jeff.morris@zerowaste.com 919-401-4444 or 360-319-2391 INLCA/LCM Conference – September 24, 2003.

E N D
Use of LCA Methods For TheRecycling vs. Disposal Issue:Prices & Costs vs. Energy & Environmental Impacts Dr. Jeffrey Morris Sound Resource Management jeff.morris@zerowaste.com 919-401-4444 or 360-319-2391 INLCA/LCM Conference – September 24, 2003
Prices for Refuse vs. Recycling,Virgin vs. Recycled Materials,&Virgin vs. Recycled Content ProductsAre Telling The Wrong Story
The Wrong Story • Recycled-content products typically cost more than virgin-content products • Recycled material prices are kept low by virgin material subsidies and virgin material prices that do not reflect public health and ecological impacts • Total costs for recycling some waste and throwing the rest away are often greater than total costs for just throwing it all away.
Curbside Recycling vs. Avoided Disposal Costs in Four WA Regions
Three Stages of a Product’s Life Cycle • EXTRACTION/MANUFACTURING • USE • WASTE MANAGEMENT
Virgin-Content ProductionUses More EnergyThanRecycled-Content Production
Virgin-Content ProductionCreates More PollutionThanRecycled-Content Production
Greenhouse Gases from Resource Extraction & Product Manufacturing
Acidification from Resource Extraction & Product Manufacturing
Eutrophication from Resource Extraction & Product Manufacturing
Additional Energy Use and Pollution from Curbside Recycling Trucks Are Overshadowed by Conservation of Energy and Reduced Pollution from Recycled-Content Production
Recycling per Curbside Available Household in Four WA Regions
Energy Used for Extraction/Manufacturing of Materials Recycled in The UW Region
The Disposal Life CycleUses More EnergyThanThe Recycling Life Cycle
Disposal Methods in WA Regions • Urban East – 90% waste-to-energy incineration • All Other Regions – 100% landfill • Landfill energy/environmental impact calculations assume 75% methane gas capture and flaring; in fact smaller, older landfills in WA do not have landfill gas capture systems. Also, 75% may be too high for actual landfill lifetime methane capture rate at most landfills.
The Disposal Life CycleGenerates More PollutionThanThe Recycling Life Cycle
Net Acidification Potential Reductions from Curbside Recycling in WA
Net Eutrophication Potential Reduc-tions from Curbside Recycling in WA
Net Human Toxicity Potential Reduc-tions from Curbside Recycling in WA
How Do We Value/Compare Environmental BenefitsAgainst Costs? • Categorize Pollutants by Impacts – global warming, acid rain, smog, eutrophication of waterways, human toxicity, ecological toxicity, etc. • Create Normalization Measures for Each Category • Economic Costs vs. Weights Developed by Political Process or Other Methods (e.g., BEES 3.0)
Monthly Value per Household of Three Environmental Benefits from Pollutant Releases Avoided Thru Curbside Recycling in UW WA
Reasonable Estimates for the Costs of Pollution Indicate That Recycling Actually Costs Less Than Garbage
Australian Kerbside Study: Recycling Costs Amount to Just 38% of Dollar Value of Net Environmental Benefits • Environmental Benefits: • 75% from upstream air & water pollution decreases • 21% from upstream land use reductions & future resource access improvements • 4% from global warming credits • 2% from reduced land use for landfills • Environmental Costs: • 2% from increased truck traffic
CO2 Value Per Ton Required to Offset Curbside Net Monthly Cost per Household in WA
Policy Options to Correct Garbage Vs. Recycling Market Failures • Taxes/subsidies to change relative prices – e.g., no-additional-charge (“free” or “bundled” or “embedded”) recycling for garbage collection subscribers – e.g., bundled commercial recycling decreases garbage disposal per employee by 10% to 20% and increases recycling by 10 percentage points. • Regulatory Actions – e.g., cap & trade and bans. • Extended Producer/Product Responsibility & Product Stewardship – e.g., deposit/refund systems.
Sulfur Dioxide Emissions Allowance Trading (average monthly prices)
Beverage Container Recycling Rates • The 10 deposit/redemption states had a beverage container recycling rate of 71.6% in 1999 (redemption rates averaged 78%, varying between 69% and 95%) • The 40 non-deposit/redemption states had a beverage container recycling rate of 27.9% in 1999