Download
1 / 28
280 likes | 446 Views
New MALDI-TOF MS with very high resolving power and mass accuracy Presented at ASMS June 3,2008. Marvin Vestal and Kevin Hayden Virgin Instruments Corp. Sudbury, MA. Objectives. Determine optimum design parameters for a high-performance bench-top MALDI-TOF Resolving power and mass accuracy

E N D
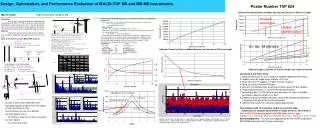
New MALDI-TOF MS with very high resolving power and mass accuracyPresented at ASMSJune 3,2008 Marvin Vestal and Kevin Hayden Virgin Instruments Corp. Sudbury, MA
Objectives • Determine optimum design parameters for a high-performance bench-top MALDI-TOF • Resolving power and mass accuracy • Sensitivity and dynamic range • High throughput • Efficient sample utilization • Simple and reliable • Low cost • Build prototype instrument and compare experimental results with theoretical predictions
Common Features of Virgin MALDI TOF • Simplified sample loading with super microplate format (102x108 mm) • Benchtop cabinet • 1.75m high x 0.5 m wide x 0.7 m deep • 100 kg max weight • 5 kHz laser, up to 100 spectra/sec • Fully automated, no operator expertise required • No joystick, no camera • 24/7 operation with minimal preventative maintenance
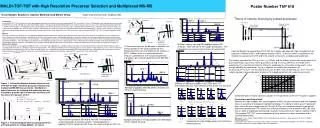
Sample plate V2 V 2-stage reflector V1 velocity focus Extraction electrode Drift tube 0 Dm d4 d40 D d3 d0 Potential diagram for high-resolution TOF with single-field source and two-field reflector. The field-free distance D is the distance from the source to the mirror plus the distance from the mirror to the detector (not shown).
Instrument Parameters for Reflecting Analyzer (single-field source and two-field mirror) De=3200, d0=6, D=2264, d3=114.2, d40=127.7 all in mm V=8.56, V1=6.31, V2=9.23 all in kV dt=1.5 nsec (0.5 nsec bins, 1 nsec single ion pulse width) Focus mass m*= 3 kDa Dv=6d0 = 36 mm, vn (for m*)=0.0235 mm/nsec Time lag Dt=d0/vn = 250 nsec K=2d0/(Dv-Ds)=0.5 Initial Conditions for MALDI (typical) dv0=400 m/sec, dx=0.01 mm Trajectory error and voltage error assumed to be small
References • M. L. Vestal and P. Juhasz, “Resolution and Mass Accuracy in Matrix-Assisted Laser Desorption Time-of-Flight Mass Spectrometry”, J. Am. Soc. Mass Spectrom. 9, 892-911 (1998). • M. L. Vestal and K. Hayden, “High-performance MALDI-TOF mass spectrometry for proteomics”, Int. J. Mass Spectrometry 268, 83-92 (2007). • M. L. Vestal and K. Hayden, “High-performance MALDI-TOF Mass Spectrometry”, paper TOFam08:15 presented at 55th ASMS Conference on Mass Spectrometry and Allied Topics, Indianapolis, June 3-7, 2007. • S. J. Hattan and M. L. Vestal, “Novel 3-D sample plate using monolithic capture media in collimated-hole structures for interfacing high capacity separations with MALDI-TOF”, poster TBP-060 presented at 56th ASMS Conference on Mass Spectrometry and Allied Topics, Indianapolis, June 3, 2008.
Contributions to relative peak width, Dm/m, with 1st and 2nd order velocity focusing Initial position, dx: Rs1 = 2[(Dv-Ds)/2d0y](dx/De) Initial velocity, dv0: Rv1 =(4d0y/De)(dv0/vn)[(1-(m/m*)1/2] Rv2 =2[2d0y/(Dv-Ds)]2 (dv0/vn)2=0 Rv3 =2[2d0y/(Dv-Ds)]3 (dv0/vn)3 Rv = Rv1 + Rv3 Time error, dt: Rt = 2dt/t = 2dtvn/De Trajectory error, dL: RL = 2dL/De Voltage error, dV: RV = dV/V Resolving power: R-1 = [Rs12 + Rv2 + Rt2 + RL2 + RV2]-1/2 Neglected in initial calculation
4 GS/s 2 GS/s 6.4 m 4 GS/s 2 GS/s 3.2 m Calculated resolving power as function of m/z, curve 1 corresponds to experimental instrument
BSA digest 13,000 11,600 Resolution is 40% of calculated Spectrum from original version
calculated Comparison of calculated resolving power with experimental results With dm/m=70 ppm due to mass independent errors. Measured 5 mchannel plate ETP MagnetTOFTM (DM167) Original version before trajectory error correction
Changes to correct mass independent errors • Add voltage regulator at input to mirror HV supplies (removes low frequency noise) • Correct trajectory error due to ion deflector • Use faster detector (0.5 ns) • ETP DM167 in place of 5 mm dual channel plate • Use faster digitizer • 0.5 ns bins>0.25 ns bins
f1 = f2 Ray diagrams indicating source of trajectory error
f1 = f2 Ray diagram showing general correction to trajectory error due to deflection
Ray diagram of final version employed in the corrected version of the experimental analyzer
100 fm peptide standards Example of spectrum obtained with corrected analyzer
BSA digest Example of spectrum obtained with corrected analyzer
2 4 GS/s 2 GS/s 1 Comparison of experimental results with theoretical calculations. Bars are measured resolving power with standard deviation of 5 replicates. Curve 1 corresponds to digitizer with 0.5 ns bins and curve 2 to 0.25 ns bins.
Calibration Equation: m1/2=D0 +D1t[1+D2t+D3t2] Determine coefficients by least square fit to multiple Peaks covering broad mass range Average=-0.1 mDa RMS =0.99 ppm RMS error for 10 peaks in spectrum of tryptic digest of BSA for all 675 spots on a 102x108 mm sample plate with automatic 2-point internal Calibration (D0 and D1) with D3 and D4 fixed.
Serial Dilution Experiment Peptide Standards Equimolar mixture diluted in 4-hydroxy-a-cyanocinnamic acid from 1 picomole/mL to 1 attomole/mL Automated acquisition and calibration averaging 2000 laser shots/spectrum at 1 kHz No data processing MH+ No. Angiotensin Fragment 1-7 899.47 1 des-Pro2 Bradykinin 963.51 2 Angiotensin II Acetate 1046.54 3 Angiotensin I 1296.69 4 Neurotensin 1672.92 5 ACTH (18-39) 2465.20 6 Glu-1 Fibrinopeptide B 1570.68 7(<10% pure)
100 fm 2 4 1 6 3 5 7 3 1 fm 1 fm 2 4 6 5 7 Examples of spectra from serial dilution of peptide standards
100 am 4 5 6 10 am
5 6 4 1 attomole Threshold 100 ions/peak 6 5
threshold 100 ions/peak 4 Matrix blank, 2V digitizer range, major matrix peaks off-scale
Test Mixture for Determining Dynamic Range Peptide Conc. (fmole/mL) MH+ No. Angiotensin Fragment 1-7 10,000 899.47 1 Angiotensin II Acetate 1,000 1046.54 3 des-Pro2 Bradykinin 100 963.51 2 Angiotensin I 2 1296.69 4 Neurotensin 1 1672.92 5 Glu-1 Fibrinopeptide B (synthetic) 0.2 1570.67 7 ACTH (18-39) 0.01 2465.20 6 BSA digest 0.1-1 1479.79 B 927.49 1283.71 1639.94, etc
Normal laser 1 3 4 B 5 B 7 2 5 Higher laser B B B B 7 B B B B
100 fm/mL peptide standards 200 Hz 5 kHz No detectable effect of laser rate on spectrum quality.
Conclusion and Future • Present status • Resolving power > 30,000 for peptides • Mass error < 2 ppm RMS over entire sample plate • Detection limit ~1 attomole/mL • Dynamic range ~105 • Performance independent of laser rate (to 5 kHz) • Future goals • Resolving power >100,000 • Mass error < 1 ppm RMS • 10x improvement in detection limit and dyanamic range • Isotopic resolution of proteins to 30,000 Da • Multiplexed MS-MS with >4000 resolving power for precursor selection and very high sensitivity and throughput • Instruments designed for specific applications, e.g. isotope ratios at ppt level limited by chemical noise
Marvin Vestal Head Virgin Chris Vestal The Boss Steve Hattan Analytical Chemist Mark Dahl EE Matt Gabeler-Lee SW Kevin Hayden Ion Optics ME Joe Valentine EE Joe Fitzpatrick Design Eng. Roger Voyer Machinist Steve Gabeler EE George Mills SW