Download
1 / 15
150 likes | 460 Views
Infographics. Or a PowerPoint on how there are other ways to present information than PowerPoint. Infographics are different The human brain processes visual information 3 times faster than verbal

E N D
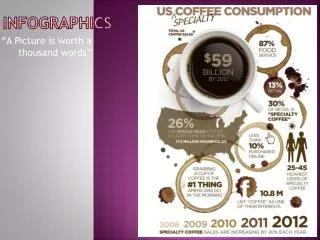
Infographics Or a PowerPoint on how there are other ways to present information than PowerPoint
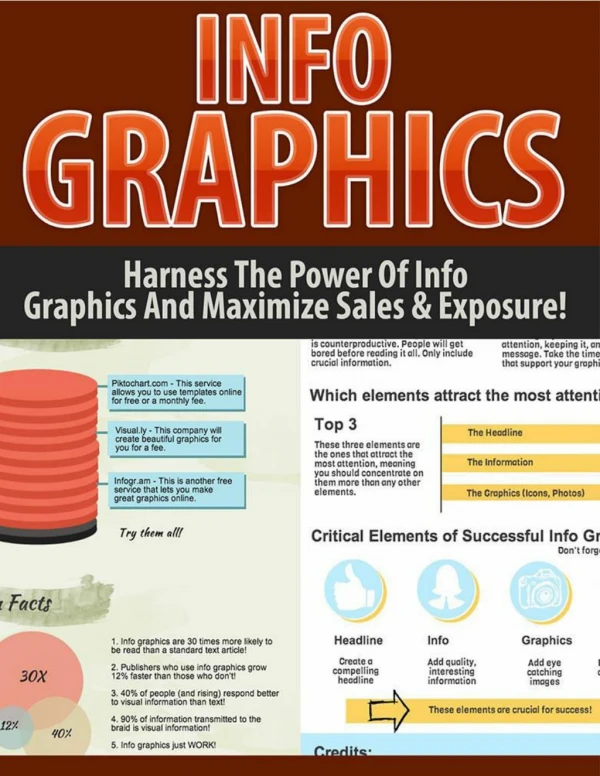
Infographics are different • The human brain processes visual information 3 times faster than verbal • People retain 50% of information presented visually and only 10% of information presented verbally Why infographics?
Have a clear idea what you are doing • Organize your information BEFORE you start • Choose the depth of your information: • One deep: purely factual, does not make connections. This is the wikipedia of infographics. • Two deep: thematic, makes connections, illustrates impact (this is where YOU will live) So, what now?
Think of this part as your outline • Group relevant data • Visualize the flow of information • Confirm connections Skeletons and flowcharts
Assign these BEFORE you start. Trust me. Devising a color scheme
Theme graphic- defining visual, always present. Should immediately alert the reader to what your infographic explores. • Reference graphic- icons used as visual pointer to avoid clutter (imagine the app icons on your phone). Graphics
Ratio of data to graphics should be 1:1 • Only use the most relevant data • USE TEXT-BASED FACTS AND STATISTICS Research and data
Choose your topic • Determine what relationship (impact, change, process) you want to represent • Sift through your facts to find the most relevant information • Start thinking about graphics and themes Okay, so what now?
This presentation • Your handout • http://spyrestudios.com/the-anatomy-of-an-infographic-5-steps-to-create-a-powerful-visual/ Resources