Download
1 / 14
140 likes | 279 Views
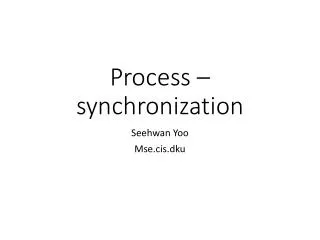
Process Synchronization and Stabilization. February 2007 Rick Selby Head of Software Products Northrop Grumman Space Technology Rick.Selby@NGC.com, 310-813-5570 Adjunct Professor of Computer Science University of Southern California Rick.Selby@USC.edu.

E N D
Process Synchronization and Stabilization February 2007 Rick Selby Head of Software Products Northrop Grumman Space Technology Rick.Selby@NGC.com, 310-813-5570 Adjunct Professor of Computer Science University of Southern California Rick.Selby@USC.edu
“Process Owners” Define, Monitor, and Improve Products & Processes Using Metric-Driven Analyses • What do managers control at different levels of an organization? • Executives – Define, monitor, and improve: • Vision, values, high-level policies, financial, etc. • “Process owners” – Define, monitor, and improve: • Processes using metric-driven analyses to improve products and services • Project managers (or “product owners”) – Define, monitor, and improve: • Products and services
Six Sigma Projects Decrease Process or Product Defects by Reducing Variances and Shifting Means • Six Sigma projects typically focus on decreasing process or product non-conformances (“defects”) through reducing variances and shifting means of process performance or product quality metrics • Projects decrease the variability of process performance or product quality metrics to improve predictability (such as smaller gaps in plans vs. actuals), efficiency (such as shorter cycletimes), and effectiveness (such as fewer defects) • Six Sigma gets it name because it states a goal of achieving no worse than 3.4 defects per million opportunities, which is six process sigma (roughly analogous to standard deviations) from the mean (99.9997% accuracy) • Commonly use DMAIC approach: Define, Measure, Analyze, Improve, and Control
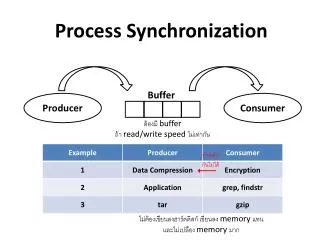
Exception process variation Exception process variation Project XYZ (Defect Density for Process X) Upper Control Limit Process Average Lower Control Limit Actual Performance Data from Project XYZ Control Charts Identify Behavior Outside of Expected Control Limit Boundaries
Control Limits Define “Voice of the Process” and Specification Limits Define “Voice of the Customer” USL UCL LCL LSL • Control limits represent “voice of the process”: Upper control limit (UCL) and lower control limit (LCL) • Derived statistically using process or product data • Help determine whether the process is stable • Specification limits represent “voice of the customer”: Upper specification limit (USL) and lower specification limit (LSL) • Represent goals, requirements, or targets • Help determine whether the process is capable
Six Sigma Project Introduced New Peer Review Process • Provided Training on Process • New Web-Based Peer Review Tool • Provided Training on Tool These defects are action items resulting from peer reviews of software code and unit testing plans and results. Data-Driven Statistical Analyses Identify Trends, Outliers, and Process Improvements for Defects • Control chart of metric data from example Six Sigma projects focusing on fault (or defect) density in peer reviews of software components • Data from 10 systems
Data-Driven Statistical Analyses Identify Trends, Outliers, and Process Improvements for Cycletimes • Web-based tracking tool deployed • Action tracking process started Specification limit defines goal for action item cycletime closure. All actions are from SW Requirements Reviews. Chart plots deltas between action item due date and closure date. Positive values indicate actions closed after their due date. Negative values indicate actions closed before their due date. Two-sample t-test confirms that data after April 1, 2004 is statistically different than data preceding this date (α < 0.05) • Control chart of metric data from example Six Sigma projects focusing on action item closure cycletime in peer reviews of software components • Data from one system
Data-Driven Statistical Analyses Identify Trends, Outliers, and Process Improvements for Cycletimes • Series of process improvements instituted and new control limits calculated Statistically significant improvement in process performance • Control chart of metric data from example Six Sigma projects focusing on change request closure cycletime for software components • Data from one system
Development 6-16 months Synchronize-and-Stabilize Timeline and Milestones: 12-36 Months from “Milestone 0” to Manufacturing
Power Power Incremental Software Builds Deliver Early Capabilities and Accelerate Integration and Test
Analyses of Software Defect Injection and Detection Phases Reveals Distributions and Gaps • Cumulative distribution of software defect injection and detection phases based on using peer reviews across 12 system development phases • 3418 defects, 731 peer reviews, 14 systems, 2.67 years
Analyses of Software Requirements Shows Leading Indicators for Implementation Scope • Data from 14 NASA systems • Ratio of implementation size to software requirements has 81:1 average and 35:1 median; Excluding system #14, the ratio has 46:1 average and 33:1 median • Ratio of software requirements to system requirements has 6:1 average
Five-Phase Process Defines Structured Approach for Six Sigma Improvement Projects • Six Sigma implementation approach can span 16 weeks and include tollgate reviews for define, measure, analyze, improve, and control phases • Tollgate reviews provide checkpoints for progress, evaluation, and feedback
Synergistic Strategies Help Enable Large-Scale Software System Development and Management Analysis Modeling Infrastructure & Techniques Infrastructure and techniques for system modeling, analysis, and simulation System modeling, evaluation, tradeoff, and prediction using simulations and empirical studies Evaluations & Feedback Analysis Capabilities Requirements & Opportunities Synthesis Models, Relationships & Feedback Processes & Architectures Flexible lifecycle process models, extensible system architectures, and pro-active development guidance mechanisms • Research focus: Large-scale, mission-critical embedded software systems • Research themes: Early lifecycle, system perspective, frequent design cycles, multi-artifact integration, scalable modelware