Download
1 / 29
290 likes | 483 Views
Let’s consider this problem…. The table below gives the proportion of time that the gerbil spends in each compartment. Compartment. A. B. C. D. Proportion. 0.25. 0.20. 0.35. 0.30. 9.(a) Is this a valid probability function? Explain. No. 0.25 + 0.20 + 0.35 + 0.30 = 1.1,

E N D
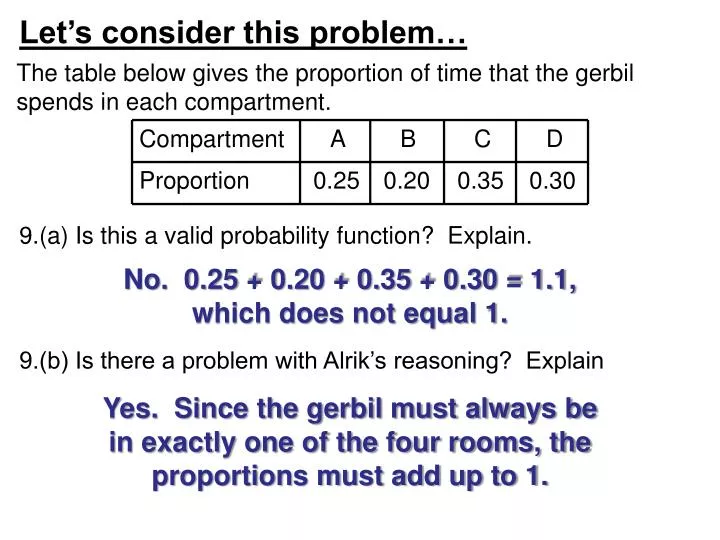
Let’s consider this problem… The table below gives the proportion of time that the gerbil spends in each compartment. Compartment A B C D Proportion 0.25 0.20 0.35 0.30 9.(a) Is this a valid probability function? Explain. No. 0.25 + 0.20 + 0.35 + 0.30 = 1.1, which does not equal 1. 9.(b) Is there a problem with Alrik’s reasoning? Explain Yes. Since the gerbil must always be in exactly one of the four rooms, the proportions must add up to 1.
Let’s consider this problem… The table below gives the proportion of time that the gerbil spends in each compartment. Compartment A B C D Proportion 0.40 0.30 0.20 0.10 10. Suppose Alrik determines that his gerbil spends time in the four compartments A, B, C, and D in the ratio 4:3:2:1. What proportions should he fill in the table above? Is this a valid probability function? Since 4 + 3 + 2 + 1 = 10, we can divide each number in the ratio by 10 and get the proportions relative to the whole.
Some Useful Diagrams for Probability Venn Diagram – good for visualizing relationships between events in a given sample space Tree Diagram – good for visualizing problems that rely on the Multiplication Principle of Probability.
In a large high school, 54% of the students are girls and 62% of the students play sports. Half of the girls at the school play sports. (a) What percentage of the students who play sports are boys? (b) If a student is chosen at random, what is the probability that it is a boy who does not play sports? (a) Ratio of boys who play sports to all students who play sports: 0.35 0.27 0.35 0.27 = 0.5645 0.62 Girls Sports 0.11 • About 56.45% of the students who play sports are boys Venn Diagram
In a large high school, 54% of the students are girls and 62% of the students play sports. Half of the girls at the school play sports. (a) What percentage of the students who play sports are boys? (b) If a student is chosen at random, what is the probability that it is a boy who does not play sports? (b) A boy that also does not play sports is represented outside of both circles: 0.27 0.35 0.27 0.11 Girls Sports • There is an 11% chance that a student chosen at random is a boy who does not play sports 0.11 Venn Diagram
Two identical cookie jars are on a counter. Jar A contains 2 chocolate chip and 2 peanut butter cookies, while jar B contains 1 chocolate chip cookie. We select a cookie at random. What is the probability that it is a chocolate chip cookie? There are 5 total cookies, 3 of which are chocolate chip… P(chocolate chip) = 3/5, right??? No the fact that the cookies are in different jars means that they are not equally likely outcomes… (i.e., the chocolate chip cookie in jar B is more likely to be chosen than any single cookie in jar A) We need to visualize this experiment as a two-step process: First choose a jar, then choose a cookie from that jar!!!
Two identical cookie jars are on a counter. Jar A contains 2 chocolate chip and 2 peanut butter cookies, while jar B contains 1 chocolate chip cookie. We select a cookie at random. What is the probability that it is a chocolate chip cookie? CC 0.125 The event “chocolate chip” is a set that contains three outcomes. Add their probabilities: 0.25 0.25 CC 0.125 Jar A 0.25 0.5 PB 0.125 0.25 P(chocolate chip) = PB 0.125 0.125 + 0.125 + 0.5 0.5 1 = 0.75 Jar B CC 0.5 Tree Diagram
Conditional Probability Our previous example is one of conditional probability, since the “cookie” outcome is dependent on the “jar” outcome. Notation: P(A|B) • Read “P of A given B” • Meaning “the probability of the event A, given • that event B occurs” Previous Example: 2 P(chocolate chip | jar A) = P(chocolate chip | jar B) = 1 4 Multiplication Principle of Probability: P(A and B) = P(A) x P(B|A)
Conditional Probability Conditional Probability Formula: If the event B depends on the event A, then P(A and B) P (B | A) = P(A)
Conditional Probability Suppose we have drawn a cookie at random from one of the jars described in the previous example. Given that it is chocolate chip, what is the probability that it came from jar A? P(jar A | chocolate chip) = P(jar A and chocolate chip) (1/2)(2/4) 1 = = P(chocolate chip) 0.75 3
Guided Practice A and B are events in a sample space S such that P(A) = 0.7, P(B) = 0.4, and P(A and B) = 0.2. 1. Find the probability that A occurs but B does not. P = 0.5 2. Find the probability that B occurs but A does not. P = 0.2 3. Find the probability that neither A nor B occurs. P = 0.1 0.5 0.2 0.2 A B 0.1
Guided Practice A and B are events in a sample space S such that P(A) = 0.7, P(B) = 0.4, and P(A and B) = 0.2. 4. Are events A and B independent? (That is, does P(A | B) = P(A))? NO P(A and B) 0.2 P(A | B) = = = 0.5 = P(A) P(B) 0.4 0.5 0.2 0.2 A B 0.1
Guided Practice If the school cafeteria serves meat loaf, there is a 70% chance that they will serve peas. If they do not serve meat loaf, there is a 30% chance that they will serve peas anyway. The students know that meat loaf will be served exactly once during the 5-day week, but they do not know which day. If tomorrow is Monday, what is the probability that (a) the cafeteria serves meat loaf? P = 0.2 (b) the cafeteria serves meat loaf and peas? P = 0.14 (c) the cafeteria serves peas? P = 0.38 0.7 ML P 0.14 0.2 NP 0.06 0.3 NML 0.3 P 0.24 0.8 0.7 NP 0.56
Let’s start with a familiar experiment You roll a fair die four times. Find the probability that you roll: (a) all 3’s. There is a probability 1/6 of rolling a three each time… Multiplication Principle: 4 P(rolling 3 four times) = (1/6)
Let’s start with a familiar experiment You roll a fair die four times. Find the probability that you roll: (b) no 3’s. There is a probability 5/6 of rolling a non-three each time… Multiplication Principle: 4 P(rolling non-3 four times) = (5/6)
Let’s start with a familiar experiment You roll a fair die four times. Find the probability that you roll: (c) exactly two 3’s. Probability of rolling two 3’s followed by two non-3’s: 2 2 (1/6) (5/6) However, there are other outcomes to consider!!! The two 3’s could occur anywhere among the four rolls In how many ways? ways
Let’s start with a familiar experiment You roll a fair die four times. Find the probability that you roll: (c) exactly two 3’s. So we have 6 possible outcomes, each with probability: 2 2 (1/6) (5/6) P(exactly two 3’s) =
Let’s start with a familiar experiment The forms of these three answers should look familiar… Let’s let p = 1/6 and q = 5/6: 4 P(four 3’s) = p These are three terms in the expansion of (p + q) !!! 4 4 P(no 3’s) = q 4 2 2 P(two 3’s) = p q 2
Let’s start with a familiar experiment The forms of these three answers should look familiar… Let’s let p = 1/6 and q = 5/6: The terms in the expansion give the exact probabilities of 4, 3, 2, 1, and 0 threes (respectively) when tossing a fair die four times!!! For this reason, such an example yields what is called a Binomial Probability Distribution
Theorem: Binomial Distribution Suppose an experiment consists of n independent repetitions of an experiment with two outcomes, called “success” and “failure.” Let P(success) = p and P(failure) = q. (Note that q = 1 – p.) n Then the terms in the binomial expansion of (p + q) give the respective probabilities of exactly n, n – 1,…, 2, 1, 0 successes. The distribution is shown on the following slide…
Number of successes out of n independent repetitions Probability
More Practice Problems Suppose Michael makes 90% of his free throws. If he shoots 20 free throws, and if his chance of making each one is independent of the other shots, what is the probability that he makes (a) all 20, (b) exactly 18, and (c) at least 18? This situation yields a binomial probability distribution, with p = success = 0.9, and q = failure = 0.1. (a) P(20 successes) = (b) P(18 successes) =
More Practice Problems Suppose Michael makes 90% of his free throws. If he shoots 20 free throws, and if his chance of making each one is independent of the other shots, what is the probability that he makes (a) all 20, (b) exactly 18, and (c) at least 18? (c) P(at least 18 successes) = P(18) + P(19) + P(20)
More Practice Problems A new medical test for a deadly virus is 0.7% likely to produce a false positive result (i.e., the test indicates the presence of the virus when it is not actually present). If 60 individuals are tested, what is the probability that (a) there will be 3 false positives, and (b) at least one false positive? Here, p = 0.007 and q = 0.993 (a) P(3 false) =
More Practice Problems A new medical test for a deadly virus is 0.7% likely to produce a false positive result (i.e., the test indicates the presence of the virus when it is not actually present). If 60 individuals are tested, what is the probability that (a) there will be 3 false positives, and (b) at least one false positive? Here, p = 0.007 and q = 0.993 (b) P(at least 1 false) = 1 – P(no false)
More Practice Problems Ten dimes, dated 1990 through 1999 are tossed. Find the probability of each of the following events. 1. Heads on the 1990 dime only. P(H-T-T-T-T-T-T-T-T-T) 2. Heads on the 1991 and 1996 dimes only. P(T-H-T-T-T-T-H-T-T-T)
More Practice Problems Ten dimes, dated 1990 through 1999 are tossed. Find the probability of each of the following events. 3. Heads on all but one dime. P(9H and 1T) 4. Exactly two heads. P(2H and 8T)