Download
1 / 26
260 likes | 267 Views
Comments are the speakers and do not necessarily represent those of the Commission. Basics of U.S. Gas Storage. 4 Types of Storage: Depleted gas/oil reservoirs Aquifers Salt caverns Liquefied natural gas (LNG). Relative Capacity of Storage Types. EIA Data. Aquifer 9%.

E N D
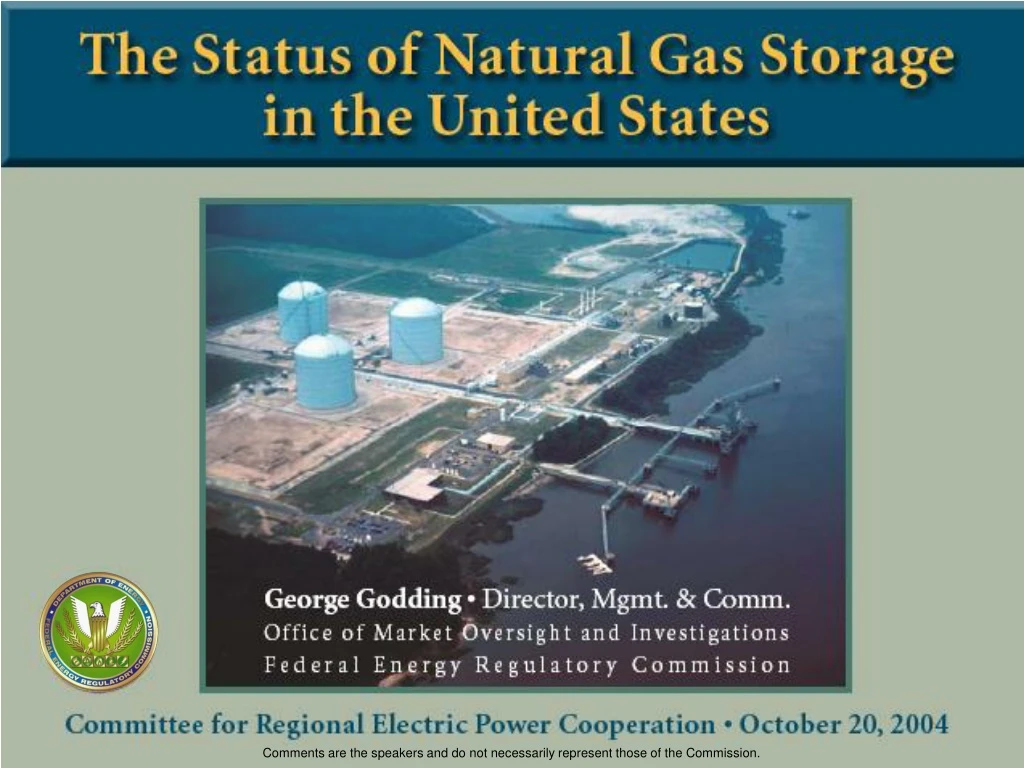
Comments are the speakers and do not necessarily represent those of the Commission.
Basics of U.S. Gas Storage 4 Types of Storage: • Depleted gas/oil reservoirs • Aquifers • Salt caverns • Liquefied natural gas (LNG)
Relative Capacity of Storage Types EIA Data Aquifer 9% Depleted Reservoir85% Salt Cavern 4% LNG Import Terminal2%
U.S. Storage by Region Storage Field Type Aquifer Storage LNG Import Terminal Salt Cavern Depleted Gas Reservoir Source: Platt’s PowerMap
Volumes of Underground Storage • Total gas storage capacity relatively unchanged over past 6 years – 8.1-8.3 Tcf • Base, or cushion, gas = approx. 50% (EIA) • However, theoretical limits not tested. • FERC staff estimates total practical storage operating capacity = 7.6 Tcf. Of that, 3.5 Tcf is working gas; 4.1 Tcf is base gas. • With reengineering, FERC estimates total working gas could be 3.6-3.8 Tcf
Working Gas Volume Fluctuates with Season • Injection season – 7 months, April-October • Withdrawal season – 5 months, November-March • Past 7-year March 31 average level – 1.1 TcfPast 7-year Oct. 31 average level – 3.1 Tcf Average refill (7 months or 213 days) – just under 2 Tcf (9.3 Bcfd) • March 31, 2001 – 0.74 Tcf in storageMarch 31, 2003 – 0.73 Tcf in storageInjecting needed 2.4 Tcf (11.3 Bcfd) proves difficult
Fluctuating Volumes (cont) • Average annual U.S. gas demand for past 5 years = 22.6 Tcf, or 62 Bcfd. • Seasonal fluctuations: April-Oct. 2003 = 50 Bcfd. Nov. 2003-March 2004 = 74 Bcfd. • When starting with low storage volume April 1, the extra 2 Bcfd (+3.2%) needed to reach 3.1 Tcf by Oct. 31 has to compete with increasing gas supply fueling power generation.
Storage Capacity – Working/Cushion Working Gas Cushion Gas
Liquefied Natural Gas (LNG)(increasingly critical) • June EIA report: 113 active LNG facilities in U.S., including: • 5 marine terminals (4 import, 1 export); • Storage facilities; and, • Operations facilities in niche markets such as LNG vehicle fuel. • Most LNG storage facilities operate only to provide peak-day supply (90 are dedicated solely to meeting storage needs of LDCs).
LNG (cont.) • Capacity of LNG storage is 86 Bcf (not counting marine terminals). • This is 2% of natural gas storage in Lower 48. • LNG storage capacity: • 82% is in East, with most of that in Northeast; • 14% in West; and, • 4% in producing region.
LNG (cont.) • Despite low LNG storage capacity to total volume: • Provides equivalent of 13% of underground storage deliverability, or about 11 Bcfd. • In East, LNG = 23% of underground storage deliverability on peak day. • In New England, LNG storage deliverability = 3.4 Bcfd. This does not include deliverability from Tractebel’s Distrigas marine terminal near Boston. • In the West, LNG storage deliverability = 1.2 Bcfd or 10% of underground storage deliverability.
Growth in Gas-FueledPower Generation • Power generation industry has greatly increased natural gas use in recent years: • In 30 years (1973-2003), the amount of power generation (million Kwh) fueled by natural gas has grown 85%. • EIA – Volume of natural gas consumed in electric power sector grew to 4.9 Tcf in 2003 from 3.1 Tcf in 1989, a 59% increase. • Gas volume used for electricity generation in all sectors grew to 6.1 Tcf in 2003 from 4 Tcf in 1989, a growth of 52%.
Natural Gas ShareOf Power Generation Fuel • EIA reported net generation in all sectors fuel usage for first-half 2004 (red is West - 2003): • Natural gas - 16.3% (19.7%); • Coal - 50.4% (42%); • Nuclear - 20.3% (11.9%); • Hydro - 7% (22.6%); • Oil - 3.3 % (0.2%); and, • and other - 2.8% (3.5%). • Generation from gas-fired plants also showed the greatest year-over-year growth (11.1%) of any fuels.
Gas Storage Expansion Plans • Underground storage: • New capacity relatively static; and, • There are efforts to update technology and operations of existing sites to increase injection and withdrawal. • LNG – A score or more of applications: • US • Canada • Mexico • Bahamas • Offshore in Gulf of Mexico and New England.
Recent Underground Storage Projects August 2004 (Capacity in Bcf) Bluewater Wyckoff (27.0) (6.0) Dominion (9.4) Seneca NGO (0.8) KM (6.0) (6.1) Tennessee (5.0) Dominion (5.6) Columbia (12.4) Saltville NGPL (5.8) Liberty Gas (17.0) NUI (10.0) Texas Gas (11.6) (8.2) Copper Eagle Caledonia (3.2) (11.0) Natural (10.7) Falcon Gas Falcon Gas (20.0) Sempra (3.0) SG Resources (24.0) EnCana (12.0) Egan (8.0) (8.0) Copiah Certificated Since 2002 (11) Gulf South (3.3) (10.6) Currently Pending (4) On the Horizon (10)
Natural Gas Storage Total U.S. Working Gas in Storage to Date Stocks were 188 Bcf above the 5-year average of 2,754 Bcf. Note: 5-year range includes data from April 1999–March 2004. Ranges are minimum and maximum weekly volumes over 5-year period. Sources: OMOI analysis; EIA Historical Weekly Storage Estimates Database, Weekly Natural Gas Storage Report. Data through the week ending .
Natural Gas Storage Total Working Gas in Storage to Date - Regional Relative Regional Storage Stocks* Producing Stocks were 96 Bcf above the 5-year average of 759 Bcf. East Consuming West Consuming Stocks were 63 Bcf above the 5-year average of 1,641 Bcf. Stocks were 29 Bcf above the 5-year average of 354 Bcf. . Sources: OMOI analysis; EIA Historical Weekly Storage Estimates Database, Weekly Natural Gas Storage Report. Data through the week ending .
Gas Futures Prices (Sept. 04) • Near-term prices declined on mild weather and healthy storage injections. • October 2004 futures reached a high of $6.76/MMBtu in late May; winter months had high at same time. • Futures prices for October 2004 fell $1.54/MMBtu ($6.10 on July 30 to $4.57 on Sept. 10). • Winter months’ prices did not fall as much as the October futures contract, causing a spread of over $2.00/MMBtu between October 04 and January 05. • Hurricane effect is a wild card in all of these prices.
Futures Prices (Sept. 10, ‘04) Source: OMOI automation; graph derived from NYMEX data on Bloomberg
Futures Prices (Oct. 4, ‘04) • Average winter (November through March) natural gas prices reported by NYMEX at the Henry Hub increased $1.24/MMBtu from the onset of Hurricane Ivan to September 30. • Average winter forward market prices at the Henry Hub averaged approximately $0.40/MMBtu greater than end of September prices. Source: Data derived from Bloomberg. Contributor: Chris Peterson and Thomas Rieley.
Futures Prices (Oct. 4, ‘04) Upward shift in the NYMEX 2004/5 winter futures prices may indicate supply concerns despite high current gas storage inventory levels Gas Futures Curve on October 4, 2004
Futures Prices – Signals? • Storage injection economics remain strong, but price signals may indicate need for more storage • Mild weather and robust storage stocks put downward pressure on spot prices. Winter strip prices remain high due to anxiety over winter weather and gas supplies. • Large differential encourages participants to buy spot gas to inject into storage and sell forward. • Falling spot prices suggest an inability to take advantage of the spread to the winter strip, perhaps lack of available storage capacity or storage injection capability as storage fields fill. (Staff confirmation)
Futures Prices – Signals? Source: Derived from Platts Gas Daily – Daily price survey.
Preliminary Storage Findings (Source: FERC staff presentation Sept. 15, 2004) • Under average conditions and from a nationwide perspective storage appears to be adequate to meet seasonal demand. • However, recent price spikes – nationally in Feb. 2003 and in New England in Jan. 2004 – indicate storage may not be sufficient to moderate prices under extreme weather. • If storage is best way to manage gas price volatility in extreme weather, consideration of the long-term adequacy of storage investment depends on how much price volatility is considered acceptable.
Preliminary Findings(cont) • National Petroleum Council last year estimated North America would need 700 Bcf more working gas storage by 2025, or +35 Bcf each year until then. • Regional needs may vary from average. • Storage types – salt cavern, LNG – because they cycle more times/year may alter additional volume/year “needs.” • FERC Fall Gas Conference on Oct. 21.
Other Issues • Improper reporting by companies of storage data. On Aug. 2, FERC required 3 companies to pay total of $8.1 million in civil penalties and customer refunds for providing preferential access to market-sensitive storage data. • One potential remedy: Required daily posting of storage data by companies. • Tech Conference held on Sept. 28.