Download
1 / 22
220 likes | 314 Views
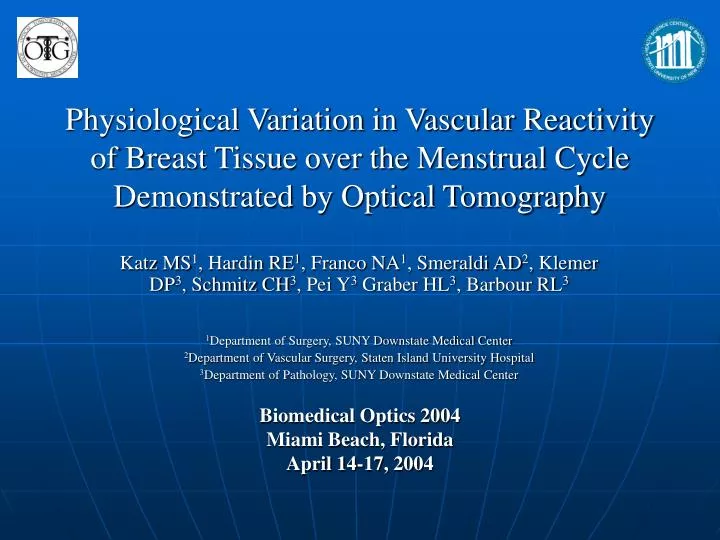
Physiological Variation in Vascular Reactivity of Breast Tissue over the Menstrual Cycle Demonstrated by Optical Tomography. Katz MS 1 , Hardin RE 1 , Franco NA 1 , Smeraldi AD 2 , Klemer DP 3 , Schmitz CH 3 , Pei Y 3 Graber HL 3 , Barbour RL 3

E N D
Physiological Variation in Vascular Reactivity of Breast Tissue over the Menstrual Cycle Demonstrated by Optical Tomography Katz MS1, Hardin RE1, Franco NA1, Smeraldi AD2, Klemer DP3, Schmitz CH3, Pei Y3 Graber HL3, Barbour RL3 1Department of Surgery, SUNY Downstate Medical Center 2Department of Vascular Surgery, Staten Island University Hospital 3Department of Pathology, SUNY Downstate Medical Center Biomedical Optics 2004 Miami Beach, Florida April 14-17, 2004
Optical Tomography Group TechnologyData AnalysisApplications • Time series imaging • Time multiplexed DC illumination • Breast Cancer • Limb • Brain • NEC • Fast reconstruction • Image enhancement techniques • Signal Analysis Quantitative Functional Imaging
Breast Cancer • Cancer is the second most common cause of death. (22%) • Breast cancer is the most common type of cancer in females. (211,300). • The second most common cause of cancer death in females. (40,110) • Most common cause of cancer death in African-American females.
Menstrual Cycle • Estrogen • Breast Enlargement • Ductal Growth • Progesterone • Ductal Maturation • Breast Swelling
Clinical Research • Badwe et al: First study demonstrating correlation between long term survival and phase of menstruation. Follicular PhaseLuteal Phase 3-12 d. after LMP. 0-2, 13-32 d. after LMP. 54% 10 yr survival 84% Badwe RA, Gregory WM, Chaudary MA, Ricahrds MA, Bentley AE, Rubens RD, Fentimen IS, “Timing of Surgery During Menstrual Cycle and Survival of Premenopausal Women with Operable Breast Cancer”, Lancet, 1991,337;1:1261-1264.
Materials and Methods • 5 Pre-menopausal healthy women were enrolled. • Subjects had each breast imaged separately using 25 source x 29 detector array. • Each women was measured 3-4 times during the menstrual cycle. • Subject were followed for 1-3 months. • Subjects were imaged for 1500 consecutive seconds. • 500 second baseline (2 time points/second). • Repeat Valsalva maneuver of 40mm Hg for 30-40 seconds. • 200 second rest period. • Data analysis consisted of applying various signal processing routines to the image time series.
Criteria for Selection of Provocation • Effects entire breast. • Repeatable. • Serves as a useful discriminator.
Pre-Menopausal Day 1 Day 12 Day 19 Day 28 Oxy-Hemoglobin Day 1 Day 12 Day 19 Day 28 Deoxy-Hemoglobin
Pre-Menopausal Day 1 Day 12 Day 19 Day 28 Oxy-Hemoglobin Subject #1 Day 5 Day 12 Day 17 Day 26 Subject #2
Pre-Menopausal Day 1 Day 12 Day 19 Day 28 Subject #1 Deoxy-Hemoglobin Day 5 Day 12 Day 17 Day 26 Subject #2
Post Menopausal Day 1 Day 8 Day 14 Day 26 Oxy-Hemoglobin Deoxy-Hemoglobin
Percentage of Variance Day 1 Day 12 Day 19 Day 28 Oxy-Hemoglobin Oxygenated Hemoglobin
Phase 1 Day 1 Day 12 Day 19 Day 28 Oxy-Hemoglobin 1- 0- 1- 0- 1- 0- 1- 0- % of SD Pairs % of SD Pairs % of SD Pairs 0 50 100 % of SD Pairs
Phase 3 Day 1 Day 12 Day 19 Day 28 Oxy-Hemoglobin Deoxy-Hemoglobin Oxy-Hemoglobin Red-Hemoglobin 1- 0- 1- 0-
Phase 4 Day 1 Day 12 Day 19 Day 28 Oxy-Hemoglobin Deoxy-Hemoglobin Oxy Hemoglobin Red Hemoglobin 1- 0- 1- 0-
Percentage of Variance-GLM 100 50 1
Spatial Map of Onset of Maximal Response Day12 Day1 Right Breast P1 Day19 Left Breast P1 Right Breast N2 Left Breast N2
Conclusions • Vascular response of breast to the Valsalva maneuver is mainly coherent and repeatable. • Response profile to Valsalva maneuver varies over the menstrual cycle. • Largest variation in profile is seen with deoxy-hemoglobin whereas largest variation in rate is seen with oxy-hemoglobin.