Download
1 / 68
680 likes | 685 Views
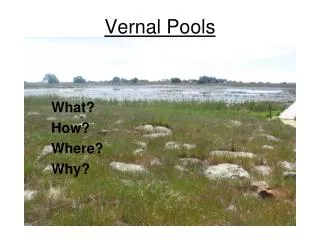
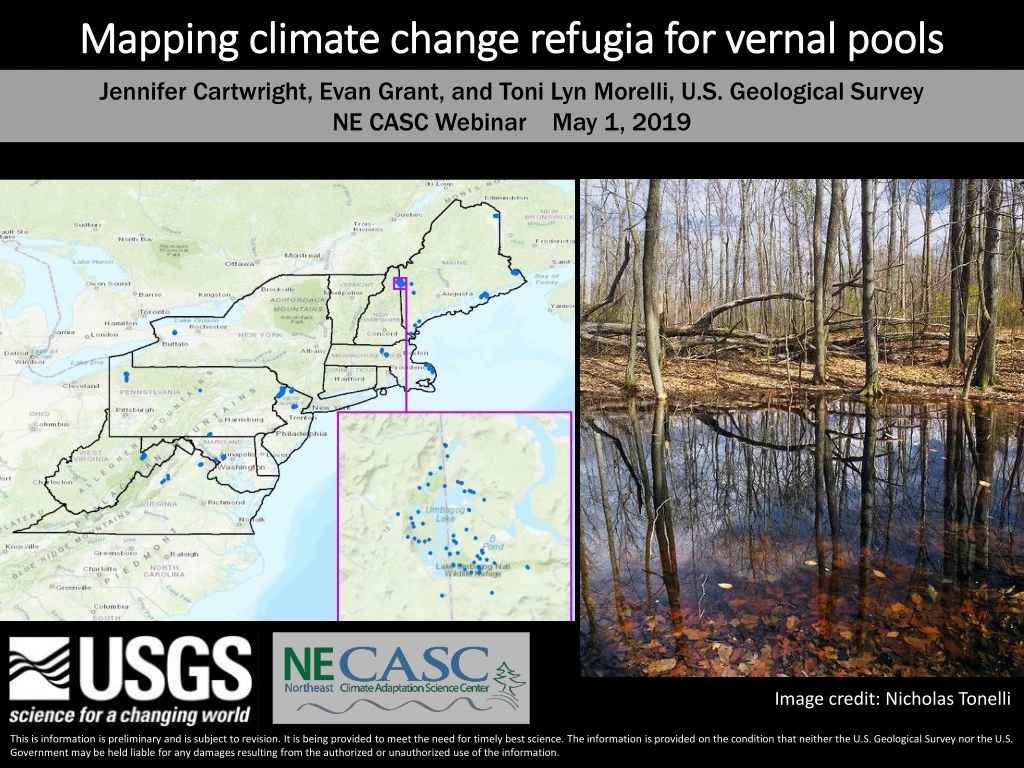
Mapping climate change refugia for vernal pools. Jennifer Cartwright, Evan Grant, and Toni Lyn Morelli, U.S. Geological Survey NE CASC Webinar May 1, 2019. Image credit: Nicholas Tonelli.

E N D
Mapping climate change refugia for vernal pools Jennifer Cartwright, Evan Grant, and Toni Lyn Morelli, U.S. Geological Survey NE CASC Webinar May 1, 2019 Image credit: Nicholas Tonelli This is information is preliminary and is subject to revision. It is being provided to meet the need for timely best science. The information is provided on the condition that neither the U.S. Geological Survey nor the U.S. Government may be held liable for any damages resulting from the authorized or unauthorized use of the information.
Overview • Importance of vernal pools • Climate-change effects • Vernal pool refugia • Data collection efforts • Vernal pool inundation modeling methods and preliminary results • Next steps for modeling • Connection to broader management in the NE
Importance of Northeastern vernal pools Image credits (clockwise): Dave Huth, Distant Hill Gardens, Peter Paplanus, National Park Service
Threats to vernal pools • Development • Roadways, fragmentation • Forestry practices • Agricultural practices • Invasive species • Diseases (e.g. ranavirus, chytrid) • Water quality • Climate change
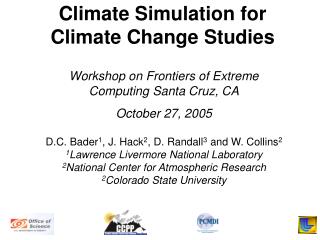
Climate projections for the Northeast Hotter, longer summers More growing-season evapotranspiration (ET) Warmer, shorter winters Less snowpack Snow-to-rain transitions in some areas Earlier spring arrival Earlier snowmelt Earlier seasonal ramp-up of ET
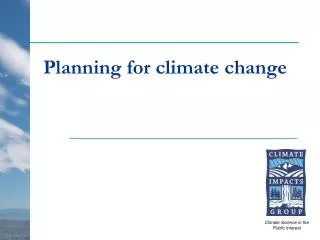
Anticipated climate change • Increased growing-season ET • Earlier ET ramp-up Possible vernal pool hydrologic effects • Earlier drawdown of water levels • Shorter hydroperiod Possible implications for amphibian ecology • Some pools could dry before life-cycle completion
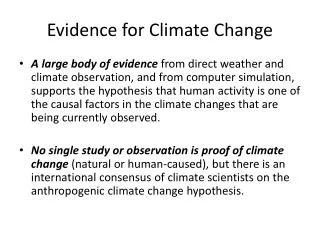
Climate-change refugia: “Areas relatively buffered from contemporary climate change over time that enable persistence of valued physical, ecological, and socio-cultural resources.” - Morelli et al. 2016
Vernal pool refugia for amphibians: Pools that continue to provide breeding habitat to allow life-cycle completion, even under accelerating climate change. Photo by Brad Carlson
Vernal pool refugia for amphibians April, current climate
Vernal pool refugia for amphibians July, current climate
Vernal pool refugia for amphibians July, future climate: hotter, more summer droughts
Vernal pool refugia for amphibians July, future climate: hotter, more summer droughts Refugia
Project goals • Assess the drivers of pool inundation patterns • Predict pool inundation under different climate conditions • Identify potential refugial pools Photo by Brad Carlson
Hypotheses: factors that contribute to pool drying Surface evaporation: • Air temperature and relative humidity • Degree of canopy shading • Pool size and bathymetry (area-to-volume ratio) Photo by Emily Starr
Hypotheses: factors that contribute to pool drying Drainage: • Pool soil drainage characteristics • Groundwater connectivity • Water loss through soil to forest transpiration Photo by Emily Starr
Data collection efforts • Amphibian Research and Monitoring Initiative (ARMI) • Monitoring surveys from early spring through summer • Inundated length, width, and depth ~ area • Total of 747 vernal pools across 19 units (e.g., wildlife refuges) in 9 states from VA to ME • Total of 10,875 inundation observations • 3,010 observations from 450 pools used for modeling, after data QA/QC and screens applied
N= 450 pools, ~3000 observations
Dataset opportunities: Large number of pools, large geographic distribution, diversity of climate conditions sampled (eg. wet years, dry years) over 12 years
Dataset challenges: For any given pool, too few observations to calculate hydroperiod. Average = 14 total observations over ~ 12 years 270 pools (more than 1/3) have ≤ 4 total observations
Pool modeling methods: • Explored process-based methods (VIC, PRMS) but potentially too coarse-scale to model many small pools • Decided on empirical machine-learning model (Boosted Regression Trees) to link pool inundation patterns to climate and vernal pool characteristics
Binary response variable: wet vs dry Any wetness: depth and area > 0 Viable breeding habitat: ≥ 5 cm depth & wetted area ≥ 5 m2
Time-varying model variables • Day of year (Julian day) • Climatic wetness at 3 time scales: • Short-term: 5-day precipitation • Medium-term: 6-month Standardized precipitation evapotranspiration index (SPEI) • Long-term: 30-year normal climatic water deficit
Pool and landscape characteristics that could be driving vernal pool inundation patterns: • Pool size and geometry • Geologic substrate, porosity, permeability • Soil characteristics • Water-table depth • Elevation • Long-term climate • Landcover, forest aboveground biomass
Vernal pool inundation modeling Most important variables: • pool area • seasonality (Julian day) • 5-day antecedent precipitation • 6-month SPEI • pool area / depth ratio • soil bulk density • forest biomass • elevation • climatic moisture deficit
Vernal pool inundation modeling May 1 Jun 1 Aug 1 Jul 1 Julian day
Vernal pool inundation modeling 5-day cumulative precipitation (mm)
Vernal pool inundation modeling 6-month SPEI
Vernal pool inundation modeling Pool size (average April area, m2)
Vernal pool inundation modeling Pool area-to-depth ratio
Vernal pool inundation modeling Forest biomass (kg / m2)
Vernal pool inundation modeling Climatic moisture deficit
Summary of preliminary results • Greater predicted wetness associated with: • earlier in season • greater recent (5-day) precipitation • wetter weather over previous 6 months
Summary of preliminary results • Pools with greater predicted wetness have: • Larger size (average area in April) • Deeper geometry, relative to area • Low-to-moderate forest biomass • Wetter climate (low 30-year climatic moisture deficit) • Shallow soil: < 110 cm* • Low-to-moderate soil permeability* • High soil organic matter* • 5-10% catchment impervious surface* • * soil variables subject to revision
Scenario modeling for individual pools May 7 Jun 12 Jul 18
Scenario modeling for individual pools May 7 Jun 12 Jul 18
Scenario modeling for individual pools May 7 Jun 12 Jul 18
Scenario modeling for individual pools May 7 Jun 12 Jul 18
Amphibian occupancy Analysis just beginning… Correlations between July 1 wetness probability and amphibian site persistence (percentage of years with breeding effort)