Download
1 / 55
550 likes | 556 Views
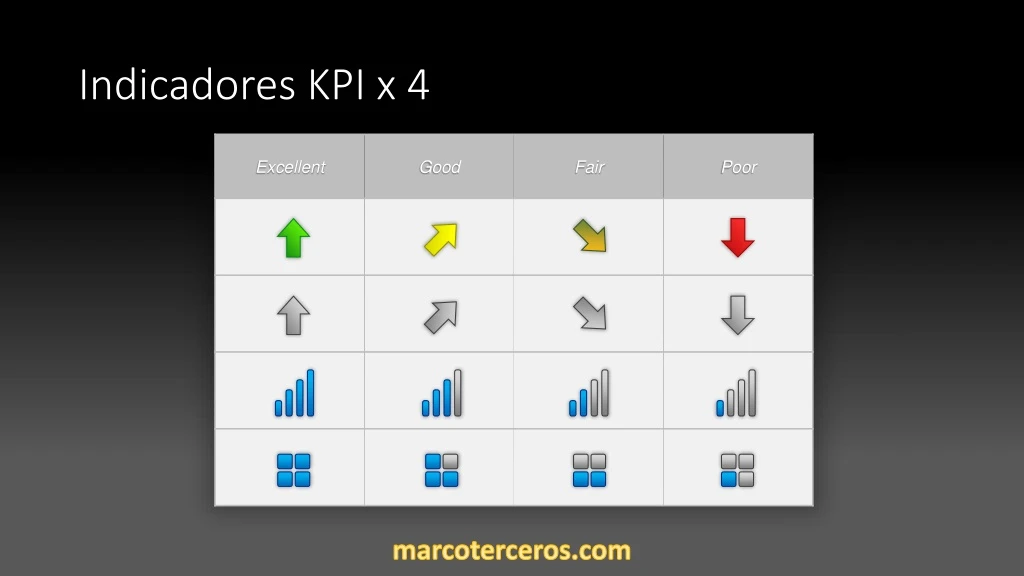
Indicadores KPI x 4. Indicadores KPI x 5. Star ratings. 5/0. 5/0.5. 5/1. 5/1.5. 5/2. 5/2.5. 5/3. 5/3.5. 5/4. 5/4.5. 5/5. AWESOME CHART ELEMENTS DASHBOARD. Pando. Title. Title. Title. Title. Beni. La Paz. Cochabamba. Santa Cruz. AWESOME CHART ELEMENTS DASHBOARD. Oruro.

E N D
Indicadores KPI x 4 marcoterceros.com
Indicadores KPI x 5 marcoterceros.com
Star ratings 5/0 5/0.5 5/1 5/1.5 5/2 5/2.5 5/3 5/3.5 5/4 5/4.5 5/5 marcoterceros.com
AWESOME CHART ELEMENTS DASHBOARD Pando Title Title Title Title Beni La Paz Cochabamba Santa Cruz AWESOME CHART ELEMENTS DASHBOARD Oruro Text 90% Sucre Potosí Text 85% Tarija Text 65% 40% Text marcoterceros.com
AWESOME CHART ELEMENTS DASHBOARD CARACAS BOGOTÁ GEORGETOWN PARAMIBO CAYENNE 60% 35% QUITO This is a sample Text This is a sample Text LIMA BRASILIA LA PAZ ASUNCIÓN AWESOME CHART ELEMENTS DASHBOARD SANTIAGO BUENOS AIRES MONTEVIDEO This is a sample text. This is a sample text. marcoterceros.com
BMI Chart 2.00 1.90 1.80 Underweight 1.70 Height (m) Obese Overweight Healthy weight 1.60 Clinically Obese 1.50 1.40 40 45 50 55 60 65 70 75 80 85 90 95 100 105 115 120 125 130 Weight (kg) marcoterceros.com
BCG Matrix for PowerPoint High Low High ? Relative Market Growth Rate Low Relative Market Share marcoterceros.com
BCG Matrix for PowerPoint High Low High ? Relative Market Growth Rate Low Relative Market Share marcoterceros.com
SWOT Analysis T O W S Weakness Strength Threat This is a sample text, insert your text here. Delete this text and replace with your own text. Opportunity This is a sample text, insert your text here. Delete this text and replace with your own text. This is a sample text, insert your text here. Delete this text and replace with your own text. This is a sample text, insert your text here. Delete this text and replace with your own text. marcoterceros.com
SWOT Analysis for PowerPoint Strength Weakness Opportunity Threat This is a sample text, insert your text here. Delete this text and replace with your own text. This is a sample text, insert your text here. Delete this text and replace with your own text. This is a sample text, insert your text here. Delete this text and replace with your own text. This is a sample text, insert your text here. Delete this text and replace with your own text. marcoterceros.com
SWOT Analysis T O W S Weakness Strength Threat This is a sample text, insert your text here. Delete this text and replace with your own text. Opportunity This is a sample text, insert your text here. Delete this text and replace with your own text. This is a sample text, insert your text here. Delete this text and replace with your own text. This is a sample text, insert your text here. Delete this text and replace with your own text. marcoterceros.com
SWOT Analysis T O W S Weakness Strength Threat • Edit here • Edit here • Edit here Opportunity • Edit here • Edit here • Edit here • Edit here • Edit here • Edit here • Edit here • Edit here • Edit here marcoterceros.com
SWOT Analysis T O W S Weakness Strength Threat • Edit here • Edit here • Edit here Opportunity • Edit here • Edit here • Edit here • Edit here • Edit here • Edit here • Edit here • Edit here • Edit here marcoterceros.com
Setting Smart Objectives The research shows that challenging objectives lead to better performance, so it is recommended to work on designing a plan and creating SMART objectives to help us achieve a healthier lifestyle. S Specific You can edit this description here M Measurable You can edit this description here A Attainable You can edit this description here R Realistic You can edit this description here T Timely You can edit this description here marcoterceros.com
Setting Smart Objectives S Specific You can edit this description here M Measurable You can edit this description here A Attainable You can edit this description here R Realistic You can edit this description here T Timely You can edit this description here marcoterceros.com
High Medium Low GE – McKinsey Matrix High Medium Market Attractiveness Low Business Unit Strength marcoterceros.com
2x2 Matrix Template Edit Text • Edit Text Edit Text Here Edit Text Here Edit Text Here Edit Text Here Edit Text Here Edit Text Here • Edit Text Edit Text Here Edit Text Here Edit Text Here Edit Text Here Edit Text Here • Edit Text This is a sample text, insert your own text, marcoterceros.com
2x2 Matrix Template Edit Text • Edit Text This is a sample text, insert your own text, • Edit Text This is a sample text, insert your own text, • Edit Text marcoterceros.com
2x2 Matrix Template • Edit Text • Edit Text This is a sample text, insert your own text, • Edit Text Sample Text • Sample Text • Sample Text • Sample Text This is a sample text, insert your own text, • Edit Text marcoterceros.com
Clocks-Insert Your Title Sample subtitle Sample subtitle This is a sample text, insert your desired text here. This is a sample text, insert your desired text here. Sample subtitle This is a sample text, insert your desired text here. Sample subtitle This is a sample text, insert your desired text here. marcoterceros.com
Clocks-Insert Your Title SAMPLE TEXT SAMPLE TEXT SAMPLE TEXT SAMPLE TEXT SAMPLE TEXT marcoterceros.com
Clocks-Insert Your Title • This is a sample text, insert your desired text here. This is a sample text, insert your desired text here. This is a sample text, insert your desired text here. • INSERT TEXT HERE • SAMPLE TEXT • This is a sample text, insert your desired text here. This is a sample text, insert your desired text here. This is a sample text, insert your desired text here. marcoterceros.com
Kaizen PICK Chart BIG Payoff SMALL Payoff This is a sample text, insert your own text, This is a sample text, insert your own text, EASY to implement Implement Possible Challenge Kill This is a sample text, insert your own text, HARD to implement marcoterceros.com
Kaizen PICK Chart BIG Payoff SMALL Payoff This is a sample text, insert your own text, EASY to implement Implement Possible Challenge Kill This is a sample text, insert your own text, HARD to implement This is a sample text, insert your own text, marcoterceros.com
Awesome Credit Score Meterfor PowerPoint 350 400 450 500 550 600 SCORE RANGE 400-450 CREDIT RATING FAIR PEOPLE IN THIS RANGE 15% marcoterceros.com
Score Level for Powerpoint 350 400 450 500 550 600 SCORE RANGE 400-450 CREDIT RATING FAIR PEOPLE IN THIS RANGE 15% This is a sample text here. Insert your desired text here. This is a sample text here. This is a sample text here. Insert your desired text here. This is a sample text here. Insert your desired text here. marcoterceros.com
Score Level for PowerPoint 350 400 450 500 550 600 SCORE RANGE 400-450 CREDIT RATING FAIR PEOPLE IN THIS RANGE 15% This is a sample text here. Insert your desired text here. This is a sample text here. This is a sample text here. Insert your desired text here. This is a sample text here. Insert your desired text here. marcoterceros.com
Score Level for Powerpoint 350 400 450 500 550 600 SCORE RANGE 400-450 CREDIT RATING FAIR PEOPLE IN THIS RANGE 15% marcoterceros.com
Iceberg Concept Sample Text Sample Text Sample Text Sample Text EDIT TITLE HERE Sample Text marcoterceros.com
Iceberg Concept EDIT TITLE HERE marcoterceros.com
Venn Diagrams Dummy Text Dummy Text Dummy Text • This is a sample text. Insert your desired text here. Again, this is a dummy text, enter your own text here. This is a sample text. Insert your desired text here. Again, this is a dummy text, enter your own text here. This is a sample text. Insert your desired text here. Dummy Text Dummy Text Dummy Text Dummy Text Dummy Text marcoterceros.com
Venn Diagrams • This is a sample text. Insert your desired text here. Again, this is a dummy text, enter your own text here. This is a sample text. Insert your desired text here. Again, this is a dummy text, enter your own text here. This is a sample text. Insert your desired text here. Dummy Text Dummy Text Dummy Text Dummy Text marcoterceros.com
Venn Diagrams Dummy Text Dummy Text Dummy Text • This is a sample text. Insert your desired text here. Again, this is a dummy text, enter your own text here. This is a sample text. Insert your desired text here. Again, this is a dummy text, enter your own text here. This is a sample text. Insert your desired text here. Dummy Text Dummy Text Dummy Text Dummy Text Dummy Text marcoterceros.com
Venn Diagrams • This is a sample text. Insert your desired text here. Again, this is a dummy text, enter your own text here. • This is a sample text. Insert your desired text here. Again, this is a dummy text, enter your own text here. Dummy Text Dummy Text Dummy Text • This is a sample text. Insert your desired text here. Again, this is a dummy text, enter your own text here. Dummy Text Dummy Text Dummy Text • This is a sample text. Insert your desired text here. Again, this is a dummy text, enter your own text here. Dummy Text • This is a sample text. Insert your desired text here. Again, this is a dummy text, enter your own text here. • This is a sample text. Insert your desired text here. Again, this is a dummy text, enter your own text here. • This is a sample text. Insert your desired text here. Again, this is a dummy text, enter your own text here. marcoterceros.com
Growth Share Matrix High Sample Text, insert your own text. This is a Sample Text This is a Sample Text Sample Text, insert your own text. Grwoth Potential Sample Text, insert your own text. This is a Sample Text Sample Text, insert your own text. This is a Sample Text Low Low High Relative Market Share marcoterceros.com
Growth Share Matrix High Sample Text, insert your own text. This is a Sample Text This is a Sample Text Sample Text, insert your own text. Grwoth Potential Sample Text, insert your own text. This is a Sample Text This is a Sample Text Sample Text, insert your own text. This is a Sample Text This is a Sample Text Low Low High Relative Market Share marcoterceros.com
Growth Share Matrix High Sample Text, insert your own text. This is a Sample Text Sample Text, insert your own text. Grwoth Potential This is a Sample Text Sample Text, insert your own text. This is a Sample Text Sample Text, insert your own text. This is a Sample Text This is a Sample Text Low Low High Relative Market Share marcoterceros.com
Decline Curve for PowerPoint This is a sample text here. Insert your desired text here. Again, this is a dummy text here. Placeholder Point 1 Point 2 Description marcoterceros.com
Decline Curve for PowerPoint Description 1 This is a sample text here. Insert your desired text here. Again, this is a dummy text here. Placeholder Description 2 Description marcoterceros.com
Decline Curve for PowerPoint Description 1 Description 2 This is a sample text here. Insert your desired text here. Again, this is a dummy text here. Placeholder Description marcoterceros.com
Decline Curve for PowerPoint Placeholder Description marcoterceros.com
Scenario Analysis PowerPoint This is a sample text here. Insert your desired text here This is a sample text here. Insert your desired text here. This is a sample text. This is a sample text here. Insert your desired text here A2 a A1 b B2 B1 Time 1 Time 2 Time 3 marcoterceros.com
Scenario Analysis PowerPoint This is a sample text here. Insert your desired text here. This is a sample text here. This is a sample text here. Insert your desired text here This is a sample text here. Insert your desired text here This is a sample text here. Insert your desired text here. This is a sample text here. Time 1 Time 2 Time 3 Time 4 marcoterceros.com
Scenario Funnels Selected Future A Scenario Funnel A This is a sample text here. Insert your desired text here. This is a sample text here. Current Situation Selected Future B Scenario Funnel B This is a sample text here. Insert your desired text here. This is a sample text here. Time 1 Time 2 Time 3 Time 4 marcoterceros.com
Break-Even Analysis Curve Cost • This is a sample text here. • Insert your desired text here. • This is a sample text. Insert your desired text here. • Insert your desired text here. • This is a sample text. Insert your desired text here. TR Total Revenue TC Profit Break Even Point Total Costs TVC Total Variabel Costs Loss FC Fixed Costs Quantity marcoterceros.com
Break-Even Analysis Curve Cost Profit Break Even Point Total Variable Costs Fixed Costs Loss Quantity marcoterceros.com
Break-Even Analysis Curve Cost TR Profit Break Even Point TC TR = TC Total Variabel Costs FC Fixed Costs Loss Quantity Sold marcoterceros.com
1 2 3 4 5 click a topic to start marcoterceros.com
Screen Title 1 Sub-Title Lorem ipsum dolor sit amet, consecteturadipiscingelit, sed do eiusmodtemporincididuntutlabore et dolore magna aliqua. Utenim ad minim veniam, quisnostrud exercitation ullamcolaboris nisi utaliquip ex eacommodoconsequat. Topic Text Topic Text Topic Text Topic Text marcoterceros.com