Download
1 / 1
10 likes | 90 Views
Luminosity Studies in Run 1b Run 1b Tevatron Lattice Parameter Measurements with Separated Beams at D-Zero. Michael A. Tartaglia, Fermilab *.

E N D
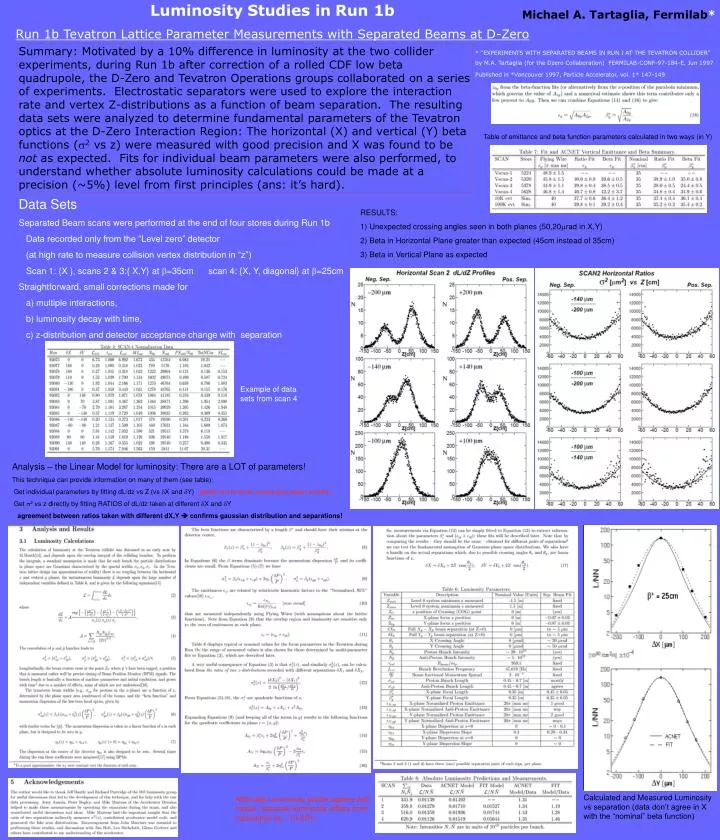
LuminosityStudies inRun 1b Run 1b Tevatron Lattice Parameter Measurements with Separated Beams at D-Zero Michael A. Tartaglia, Fermilab* Summary: Motivated by a 10% difference in luminosity at the two collider experiments, during Run 1b after correction of a rolled CDF low beta quadrupole, the D-Zero and Tevatron Operations groups collaborated on a series of experiments. Electrostatic separators were used to explore the interaction rate and vertex Z-distributions as a function of beam separation. The resulting data sets were analyzed to determine fundamental parameters of the Tevatron optics at the D-Zero Interaction Region: The horizontal (X) and vertical (Y) beta functions (s2 vs z) were measured with good precision and X was found to be not as expected. Fits for individual beam parameters were also performed, to understand whether absolute luminosity calculations could be made at a precision (~5%) level from first principles (ans: it’s hard). * “EXPERIMENTS WITH SEPARATED BEAMS IN RUN I AT THE TEVATRON COLLIDER” by M.A. Tartaglia (for the Dzero Collaboration) FERMILAB-CONF-97-184-E, Jun 1997 Published in *Vancouver 1997, Particle Accelerator, vol. 1* 147-149 Table of emittance and beta function parameters calculated in two ways (in Y) Data Sets Separated Beam scans were performed at the end of four stores during Run 1b Data recorded only from the “Level zero” detector (at high rate to measure collision vertex distribution in “z”) Scan 1: {X }, scans 2 & 3:{ X,Y} at b=35cm scan 4: {X, Y, diagonal} at b=25cm Straightforward, small corrections made for a) multiple interactions, b) luminosity decay with time, c) z-distribution and detector acceptance change with separation RESULTS: 1) Unexpected crossing angles seen in both planes (50,20mrad in X,Y) 2) Beta in Horizontal Plane greater than expected (45cm instead of 35cm) 3) Beta in Vertical Plane as expected Example of data sets from scan 4 Analysis – the Linear Model for luminosity: There are a LOT of parameters! This technique can provide information on many of them (see table): Get individual parameters by fitting dL/dz vs Z (vs dX and dY) (global fit not done, would give better results) Get s2 vs z directly by fitting RATIOS of dL/dz taken at different dX and dY agreement between ratios taken with different dX,Y confirms gaussian distribution and separations! Calculated and Measured Luminosity vs separation (data don’t agree in X with the “nominal” beta function) Although Luminosity profile agrees with model, absolute luminosity differs from calculation by ~10-20%