Download
1 / 28
280 likes | 353 Views
Revealing regulatory mechanisms through functional interaction mapping. Thomas Sandmann German Cancer Research Center, DKFZ, Heidelberg, Germany. Specific results with cheap components. Akt1 motif RegPhos. Pum1 motif Hafner et al, 2010.

E N D
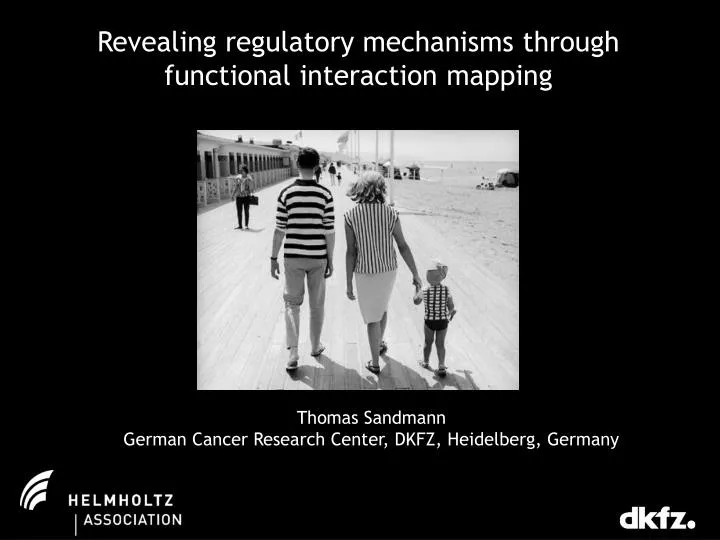
Revealing regulatory mechanisms through functional interaction mapping Thomas Sandmann German Cancer Research Center, DKFZ, Heidelberg, Germany
Specific results with cheap components Akt1 motif RegPhos Pum1 motif Hafner et al, 2010 "Many of the genetic disorders that were described previously as monogenic are in fact the product of defects at a small number of loci.” Badano and Katsanis, 2002 Twist motif Ozdemir et al, 2011 mir-1 seeds TargetRank
Genetic interaction… ‘… refers to an unexpected phenotype not easily explained by combining the effects of individual genetic variants’. Dixon et al., 2009
Predicting co-RNAi phenotypes main effect of dsRNAj baseline error term measurement (growth, cells, …) main effect of dsRNAi interaction term Reproducibility: Features R=0.95 (cell number) Interactions R=0.62 (cell number)
RNAi2 • 93 signal transducers (detected by RNAseq) • 2 biological replicates (overall ~74.000 co-RNAi assays)
Genetic interaction matrix: nuclear area Nuclear area
Observing different features revealsnon-redundant sets of interactions FDR < 0.05 Significant enrichment of annotated Drosophila genetic interactions and orthologous human protein-protein interactions
Identifying pathway components Training and classification using sparse Linear Discriminant Analysis (LDA) Distance to the apexes: predicted class probabilities Circle diameter: probability of assignment to any of the three classes
Cka is a novel modulator ofRas/ERK signaling sty qRT-PCR Western blot Co-immunoprecipitation Student’s t-test, *p<0.05, **p<0.01, n = 4 Drosophila S2 cells, starved O/N in serum-free medium Drosophila S2 cells Ckaorthologs perform a conserved function in human cells
Genetic interactions in vivo • Ckaloss-of-function suppresses ElpB1ectopic wing vein phenotype
Genetic interactions in vivo A P wt sev->RasV12 sev->RasV12 / Cka1 sev->RasV12 / Cka4 • Ckaloss-of-function suppresses RasV12 rough eye phenotype
Conclusions Quantitative, combinatorial RNAi yields informative genetic interaction profiles in vitro. Analysis of different phenotypes reveals non-redundant sets of interactions. Cka is a novel, conserved regulator of Ras/MAPK signaling.
Outlook I. Chromatin biology II. RNA biology III. Signal transduction
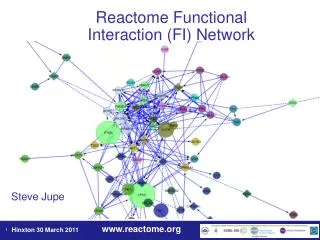
Outlook I: The functional interaction landscape of chromatin biology Modified from modENCODE, Science, 2010 1,400 genes – transcription factors, chromatin modifiers, replication, cell cycle regulators, etc
Interaction matrix 100 dsRNAs … ~1600 384-well plates ~ 300.000 measurements ~ 2800 dsRNAs (template) …
Multi-channel, automated fluorescence microscopy ctrl dsRNA Rho1 dsRNA Dynein light chain dsRNA HOECHST, Tubulin, phospho-Histone-3
Automated image analysis Segmentation of nuclei Segmentation of cell body
Quantitative phenotypes Nuclear area Cell number z-scores z-scores Local cell density Mitotic ratio z-scores z-scores th msk dsor1 pten drk gap1 Fluc pnt kay
Cell cycle stages Interphase Prophase Prometaphase Metaphase Anaphase Telophase Cytokinesis Dead cells Binucleated
Functional interaction analysis • What is the function of uncharacterized chromatin-associated loci ? • What is the molecular basis for the observed interactions ? • ChIP-Seq, RNAseq • Are these interactions important in vivo / in other species ? • Fly genetics toolkit, e.g. mutants, UAS-Gal4 • Analysis of orthologs in human cells, vertebrate models • How conserved are genetic interactions globally ? • Comparison with fission and budding yeast datasets • Can interaction maps act as “biofilters” for the statistical analysis of population genetics data ?
Outlook II: Regulatory RNA and RNA regulators Keene, Nature Reviews Genetics, 2007
Genomics … • Delineate the genetic interaction network of RNA biology • RNA-binding proteins (> 300 putative RBPs in Drosophila) • long ncRNAs (~ 1800 candidates identified by modEncode) • miRNAs (176 Drosophila miRNAs) … genetics and biochemistry • Perturbation of functional pairs in vivo – e.g. miRNA + targets • Characterization of molecular phenotypes (RNAseq) • Identification of physical interactors (e.g PAR-CLIP, RaPID)
Outlook III: Functional network rewiring after oncogene activation COT Hahn and Weinberg, 2002 Johannessen et al, 2010
Differential epistasis analysis Inspired by Bandyopadhyay et al, Science, 2010
Outlook III: Functional network rewiring after oncogene activation 1.) interactions in wt cells 2.) interactions in oncogene expressing cells 3.) differential interaction networks
Interactions Michael Boutros Wolfgang Huber