Download

1 / 1
20 likes | 183 Views
MoNA Experiments Eileen Chang, Amanda Erwin, Brandy Morgan, Lo-Han Yuan. Experiment 2. Experiment 1. Experiment 3. Purpose: Calculate the mystery position of the source (how many centimeters the source is placed from the left edge of the MoNA bar).

E N D
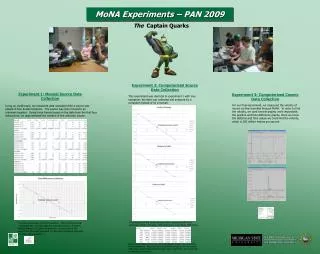
MoNA Experiments Eileen Chang, Amanda Erwin, Brandy Morgan, Lo-Han Yuan Experiment 2 Experiment 1 Experiment 3 • Purpose: Calculate the mystery position of the source (how many centimeters the source is placed from the left edge of the MoNA bar). • Purpose: Calculate the distance of the source in a mystery spot. • Tools used: SpecTcl software, measuring tape, MoNA • Procedure: The difference in time (T1-Tr), the difference in the peaks (P1-Pr), and the COG (P1-Pr)/(P1-Pr) were extracted from five different fixed locations. By taking the Full Width at Half Maximum and dividing it by the square root of the total number of counts, the error was calculated. With this data, two graphs were made showing the relationship between position of the source and the time, and the relationship between the position of the source and COG. • Result: From the graphs, the best fit line was y = -0.1282x + 12.363, so by plugging in y= -.11632, our answer was x= 97.343 • Tools Used: Oscilloscope, measuring tape, Excel, MoNA • Procedure: Four separate pieces of data were taken, where the known independent variable, x, corresponded to the distance the source was from the left edge of MoNA bars. The two signals indicated the scintillation light coming from the left and right PMTs. From this, the time differences between the beginnings of the left PMT signal and the right PMT signal (Tl-Tr) can be found. In addition, the peaks of the left and right signals can be determined, which indicate the difference in charge. From this data, two graphs were made in Excel: X vs. (Tl-Tr), and X vs. (Pl-Pr)/(Pl+Pr). • Results: From our graph, X vs. (Tl-Tr), the best-fit line was y= 13.336x-12.486, so by plugging in y= -1.333 , we got x=.836 m. This meant that the source was .836 meters away from the left side of MoNA. • Purpose: Find the velocity of a Muon • Tools used: SpecTcl, MoNA, Calculator • Procedure: To determine the velocity of a Muon, the time it takes for an incoming vertical muon to travel the distance of 150 cm from bar 15 to bar 0 on MoNA needs to be found. Using SpecTcl, the distance 0 was gated, thus focusing on the muons entering at a 90° angle. Using the same gate around time, the difference in time was determined. Time was plugged into the equation V=D/T. • Results: V= 1.50 m/ (5.1E-9)s= 2.94E8 m/s • The velocity that the cosmic ray muons are traveling at is approximately 3E8 m/s, the speed of light. From the data, velocity was calculated to be 2.94E8 m/s, which is very close. Plastic Scintillator Photo-Multiplier Tube (PMT) Voltage Divider Light Guide