Download
1 / 26
260 likes | 388 Views
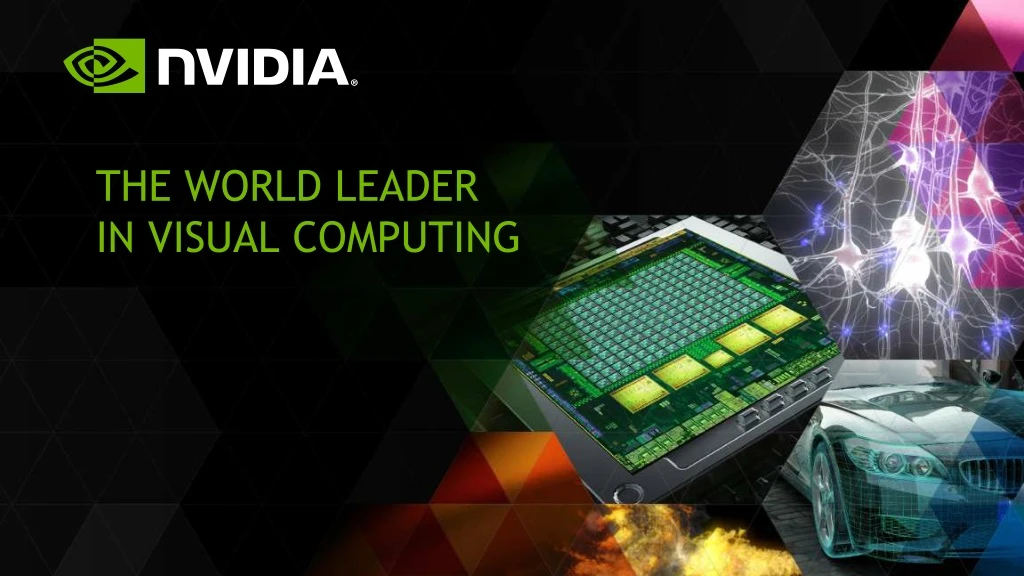
NVIDIA CEO and Co-founder Jen-Hsun Huang shared his business overview during an investor tour in July 2014.

E N D
THE WORLD LEADER IN VISUAL COMPUTING
SAFE HARBOR FORWARD-LOOKING STATEMENTS Except for the historical information contained herein, certain matters in this presentation including, but not limited to, statements as to: our strategies, performance, growth drivers, growth, opportunities, leadership, pipelines and design wins; estimates and forecasts; the expansion of visual computing; value to shareholders and our commitment to capital return; growing markets for our products; the performance and benefits of our products and technologies; and other predictions and estimates are forward-looking statements within the meaning of the Private Securities Litigation Reform Act of 1995. These forward-looking statements and any other forward-looking statements that go beyond historical facts that are made in this presentation are subject to risks and uncertainties that may cause actual results to differ materially. Important factors that could cause actual results to differ materially include: global economic conditions; our reliance on third parties to manufacture, assemble, package and test our products; the impact of technological development and competition; development of new products and technologies or enhancements to our existing product and technologies; market acceptance of our products or our partners products; design, manufacturing or software defects; changes in consumer preferences and demands; changes in industry standards and interfaces; unexpected loss of performance of our products or technologies when integrated into systems and other factors. For a complete discussion of factors that could materially affect our financial results and operations, please refer to the reports we file from time to time with the SEC, including our Form 10-Q for the quarterly period ended April 27, 2014. Copies of reports we file with the SEC are posted on our website and are available from NVIDIA without charge. These forward-looking statements are not guarantees of future performance and speak only as of July 6, 2014, based on information currently available to us. Except as required by law, NVIDIA disclaims any obligation to update these forward-looking statements to reflect future events or circumstances. FINANCIAL MEASURES This presentation contains historical revenue amounts for certain of our product lines and businesses which provides investors with additional information to supplement the segment reporting information contained in our Form 10-K for the fiscal period ended January 26, 2014. In addition to U.S. GAAP financials, this presentation includes certain non-GAAP financial measures. These non- GAAP financial measures are in addition to, and not a substitute for or superior to, measures of financial performance prepared in accordance with U.S. GAAP. See the Appendix for a reconciliation between each non-GAAP measure and the most comparable GAAP measure. Where we present non-GAAP financial measures, we generally exclude stock-based compensation, acquisition related items, net warranty charges, and other income and expense.
HPC DESIGN and VISUALIZATION GRAPHICS CARDS AUTO GPUs and SOCs SYSTEMS GAMING IP 3
DRIVING GROWTH Revenue 13% CAGR Record GM % + 1,000 BPS EPS 7% CAGR 55.1% $4,116 $0.99 45.1% $0.81 $2,856 FY'11 FY'14 FY'11 FY'14 FY'11 FY'14 4 Revenue excludes chipset. Non-GAAP GM and EPS, see reconciliation in Appendix.
PC GeForce growth is driven by more gamers globally and games with ever-increasing production value. GROWTH DRIVERS IN GROWING MARKETS CLOUD Tesla and GRID are cloud GPU platforms that are made possible by technologies we invented — GPGPU and virtual GPU. Their growth is driven by enterprise virtualization and internet service provider adoption of high performance computing and big data analytics. MOBILE Tegra leverages NVIDIA’s visual computing capabilities for mobile gaming, intelligent cars, robot computer vision, and mobile devices. 5
GROWTH IN PC GeForce and Quadro +14% 900 800 700 Global PC gaming growing at 12% CAGR 600 Revenue (in millions) Steam, #1 digital game store, grew to 75M active accounts (from 65M last Oct) 500 Tencent, #1 PC game company, grew 23% Q-Q 400 Huge new titles this fall — Call of Duty, Battlefield, Assassin’s Creed, Evolve and The Crew 300 200 4K monitors need more powerful GPUs — forecasted to grow from 2M to 12M over next 3 years 100 Upcoming NVIDIA Maxwell GPU & Intel Grantley start new workstation cycle 0 Q1'14 Q1'15 6 SOURCE: Core PC gaming 12% CAGR: Newzoo. 4K monitor growth: Display Search.
GROWTH IN CLOUD Tesla and GRID 60 +29% Google, Facebook, Baidu, Netflix revealed machine learning efforts on Tesla 40 Revenue (in millions) 15 of “Top 15” most energy-efficient supercomputers in the world now powered by Tesla (Last year was 10 of “Top 10”) IBM announced supercomputer with Tesla 20 VMware announced support for GRID Broadcom, Cavium, AMCC announced ARM64 CPU supporting Tesla >800 enterprise GRID trials on-going 0 Q1'14 Q1'15 7 SOURCE: “Top 15” in Green500 list, June ‘14.
GROWTH IN MOBILE Tegra 160 +42% 140 120 Tegra K1 is the highest performance mobile processor — powers Xiaomi’s first tablet 100 Revenue (in millions) Auto >$100M in FY15, ~$2B win pipeline to ship in next few years 80 Google announces new initiatives to extend Android beyond phones — Tegra K1 featured prominently: 60 40 1st64-bit ARM 1stAndroid TV 1stAndroid extensions for gaming (AEP) 1stTablet with computer vision 1stAndroid Auto 20 0 Q1'14 Q1'15 8
ANDROID BEYOND PHONES — GAMES, TV & CARS 1stAndroid TV 1stTablet with Computer Vision 1-of-2 Chromebook ARM SOCs 1stAndroid Auto 1st64bit ARM (Android L) 1stAEP/Mobile Gaming 9
“ It would be an understatement to say that apart from Google’s new playthings, NVIDIA has been ubiquitous at the I/O developer conference as well – with its Tegra K1 chip seemingly at the heart of all things cool.” “ It will be exciting to see a new generation of games enabled by more powerful hardware like NVIDIA’s Tegra K1” “ NVIDIA has been a pervasive presence at the show, though you mightn’t noticed… Tegra K1 lies at the center of many of Google’s recent efforts.” “ A new focus on Android gaming has emerged at Google’s I/O 2014 event, with Nvidia’s Tegra K1 processor showcasing the raw processing potential of the next wave of mobile technology.” “ Google Kicks It Up A Notch and Both NVIDIA and Lenovo Win at Google I/O.” “ At the Google I/O Keynote, NVIDIA has a central role to play, and as it turns out, the company’s Tegra K1 will be the powerhouse fueling Google’s recent endeavors.” “ The Google I/O showcased the close collaboration between Google and NVIDIA, Tegra K1-powered devices is everywhere on the show floor.” 10
FUTURE CARS NEED VISUAL SUPERCOMPUTERS Augmented Reality HUD Photorealistic Materials High Fidelity Navigation Natural Language Processing Intelligent Driver Assist Driver Interactions 20+ brands 100+ models ~30M cars NVIDIA WINS IN: ON THE ROAD TODAY: 5.1M cars with NVIDIA 11
GAMING AND AUTO ARE LARGE AND GROWING MOBILE OPPORTUNITIES. WHAT ABOUT MOBILE DEVICES? Leveraging our GPU assets, we can consistently build the most advanced mobile processors and capture design wins — Xiaomi, Google, etc. We partner with leading wireless, connectivity, and analog companies — ICERA, EMP, BRCM, INTC, Maxim, TI — to create differentiated platforms. And we can license GPU IP to vertically integrated companies to create specialized mobile products. GFXBench
GEFORCE IS GROWING IN THE FACE OF A SLOWING PC MARKET, COMPETITION AND CONSOLES. CAN IT CONTINUE? 75% GeForce Share GeForce is about PC gaming — global PC gaming is growing at 12% CAGR. PC is vibrant because it is an open platform that allows new business models that are friendly to developers — League of Legends, DOTA, etc. 50% PC technology continuously advances to enable new experiences — 4K displays, Oculus VR, etc. 25% Gamers are loyal to GeForce because we deliver the highest quality software and the best gaming experience. GeForce is rich with software capabilities that are designed just for gaming — GeForce Experience, ShadowPlay, GameWorks. Q111 Q112 Q113 Q114 13 GeForce market share, calendar quarters: Mercury Research. Core PC gaming 12% CAGR: Newzoo.
ENTERPRISE VIRTUALIZATION IS A LARGE MARKET. HOW DO WE ESTIMATE THE SIZE OF THE OPPORTUNITY? DESIGNER 25M POWER USER 625M enterprise users 200M Virtualization 2.0 /20 concurrent users per GPU *$1750 GRID GPU ASP KNOWLEDGE WORKER 400M /4 enterprise IT refresh rate = ~$13.7B TAM TASK WORKER Virtualization 1.0 100M 14
7000 PATENT PORTFOLIO GROWTH HOW IMPORTANT IS IP LICENSING TO OUR EARNINGS GROWTH? 6000 5000 4000 3000 2000 1000 0 NVIDIA monetizes innovation through product sales and technology licensing. We expect to see continued contributions from core and IP licensing in the future. One of the important elements of our Tegra strategy is licensing IP to vertically integrated companies. It is difficult to estimate the mix of product sales to royalties. We expect significant growth from Tesla, GRID, Tegra, as well as IP core licensing. Our focus is driving overall earnings growth. 2003 2004 2005 2006 2007 2008 2009 2010 2011 2012 2013 2014 40% TESLA GROWTH % total Top500 performance from GPUs 30% 20% 10% 0% 2006 2007 2008 2009 2010 2011 2012 2013 2014 1000 ANDROID BEYOND PHONES GRID GROWTH # enterprise trials 800 1st64-bit ARM 1stAndroid TV 1stAndroid for gaming 1stTablet with computer vision 1stAndroid Auto 600 400 200 0 June July Aug Sept Oct Nov Dec Jan Feb Mar Apr May Jun 15
GROSS MARGIN HAS INCREASED TO A RECORD 55%. WHAT CAN WE EXPECT GOING FORWARD? Billions $6 60 % Revenue Gross Margin 55% $5 NVIDIA has transformed from a PC components business to a visual computing solutions business where complex software is a major part of our value. $4.3 50 % $4.1 $4.0 $4 $3.5 $3.3 For example, GRID is possible because of GPU virtualization software, Tesla is special because of the CUDA parallel programming architecture and tools, and GeForce is special because of GameWorks and GeForce Experience. $3 40 % 39% $2 Growth in Tesla, Quadro, GeForce gaming, and GRID will increase corporate margins. Growth in Tegra will decrease corporate margins while increasing earnings. $1 30 % FY'10 FY'11 FY'12 FY'13 FY'14 16 Gross Margin is a Non-GAAP measure, see reconciliation in Appendix.
DRIVING RETURN ON INVESTMENT Extending into Mobile-Cloud ENTERING NEW MARKETS EFFICIENTLY LEVERAGING IP +42% MOBILE CLOUD +29% Q1'14 Q1'15 Q1'14 Q1'15
CREATING SHAREHOLDER VALUE PC up 14% Cloud up 29% Mobile up 42% DRIVING GROWTH 1,000 GM basis pts increase since FY′11 EXCELLING IN OPERATIONS $3.7B cash generated since FY'10 $1B allocated for return in FY′15 $0.34/share annual dividend Long-term commitment to capital return GENERATING CASH AND RETURNING TO SHAREHOLDERS 18 Revenue comparisons Q1 FY15 vs. Q1 FY14. Non-GAAP GM, reconciliation in Appendix.
STRONG CASH GENERATION Total of $3.7B in last five years OCF/Millions $1,000 $835 $750 $488 $500 $250 $- FY'10 FY'14 (Operating cash flow)
CAPITAL RETURN ENHANCES SHAREHOLDER VALUE CAPITAL RETURN SHARES OUTSTANDING Millions Millions $1,200 700 $900 650 Intended Return to Shareholders 617 612 $600 600 568 $300 550 Capital Returned to Shareholders $- 500 FY'12 FY'13 FY'14 FY'15 FY'12 FY'13 FY'14
GROWTH IN LARGE MARKETS PC MOBILE CLOUD Cash generation in large growing market Automotive base and opportunities in gaming Proven growth and exposure to cloud & enterprise virtualization
RECONCILIATION OF NON-GAAP TO GAAP FINANCIAL MEASURES FY2011 FY2014 Revenue, excluding chipset $2,856 $4,116 Chipset revenue 687 14 Revenue $3,543 $4,130 (in millions)
RECONCILIATION OF NON-GAAP TO GAAP FINANCIAL MEASURES Stock-based compensation (a) Net warranty charges (b) Non-GAAP Other (c) GAAP FY2010 (0.7) (2.9) — Gross margin 39.0% 35.4% FY2011 (0.2) (5.1) — Gross margin 45.1% 39.8% FY2012 (0.3) — (0.1) Gross margin 51.9% 51.5% FY2013 (0.3) — — Gross margin 52.3% 52.0% FY2014 (0.3) 0.2 (0.1) Gross margin 55.1% 54.9% Footnotes (a) In addition to our historical practice of excluding stock-based compensation, during FY10, the Company completed a tender offer to purchase outstanding stock options which resulted in a charge of $140.2 million. This charge was allocated to cost of goods sold of $11.4 million which resulted in 0.3% impact to gross margin. (b) Consists of charges for the weak die/packaging material set that was used in certain versions of our previous generation chips and the release of the remaining warranty reserve balance in FY2014. (c) Comprised of legal settlement charges.
RECONCILIATION OF NON-GAAP TO GAAP FINANCIAL MEASURES Stock-based compensation (a) Acquisition- related items (b) Net warranty charges (c) Tax impact of non-GAAP adjustments Non-GAAP Other (d) GAAP FY2011 $3,543 $- $- $- $- $3,543 Revenue $- $1,598 $(8) $- $(181) $- $1,409 Gross profit $- Gross margin 45.1% (0.2)% - (5.1)% - - 39.8% $1,096 $92 $9 $13 $(57) $1,153 Operating expense $- $502 $(100) $(9) $(194) $57 $256 Operating income $- $476 $(100) $(9) $(194) $57 $23 $253 Net income Shares used in diluted per share calculation Diluted net income per share 589 - - - - - 589 $0.81 $0.43 $- $- $- $- $-
RECONCILIATION OF NON-GAAP TO GAAP FINANCIAL MEASURES Other income & expense (e) Stock-based compensatio n (a) Acquisition- related items (b) Net warranty charges (c) Tax impact of non-GAAP adjustments Non-GAAP Other (d) GAAP FY2014 $4,130 $- $- $- $- $4,130 Revenue $- $- $2,274 $(11) $- $8 $(3) $2,268 Gross profit $- $- Gross margin 55.1% (0.3)% - 0.2% (0.1)% - - 54.9% $1,610 $126 $32 $- $4 $1,772 Operating expense $- $- $664 $(137) $(32) $8 $(7) $496 Operating income $- $- $588 $(137) $(32) $8 $(7) $(2) $22 $440 Net income Shares used in diluted per share calculation Diluted net income per share 595 - - - - - - 595 $0.99 $0.74 $- $- $- $- $- $- Footnotes (a) The stock-based compensation charge was allocated to cost of goods sold, research and development expense, and sales, general and administrative expense. (b) Acquisition-related items are comprised of amortization of acquisition-related intangible assets and other acquisition-related costs such as transaction costs, compensation charges and restructuring costs relating to the acquisitions. (c) Net warranty charges are comprised of charges to cost of goods sold related to the weak die/packaging material set that was used in certain versions of our previous generation chips and a charge to operating expense related to a class action lawsuit settlement, net of insurance reimbursement and reserve releases. (d) Other is comprised of legal settlement charges and benefits. (e) Other income and expense is comprised of gain on sale of non-affiliated investments and interest expense related to the debt discount portion of convertible notes.