Download
1 / 12
140 likes | 319 Views
Emergent Enterprise Technology Report. Data Visualization. Data Visualization Overview Impact on Organizations Looking Ahead. Topic Report. What is it? Visual Display of Data Schema Picture Chart Interactive Program. Data Visualization Overview. What is the goal?

E N D
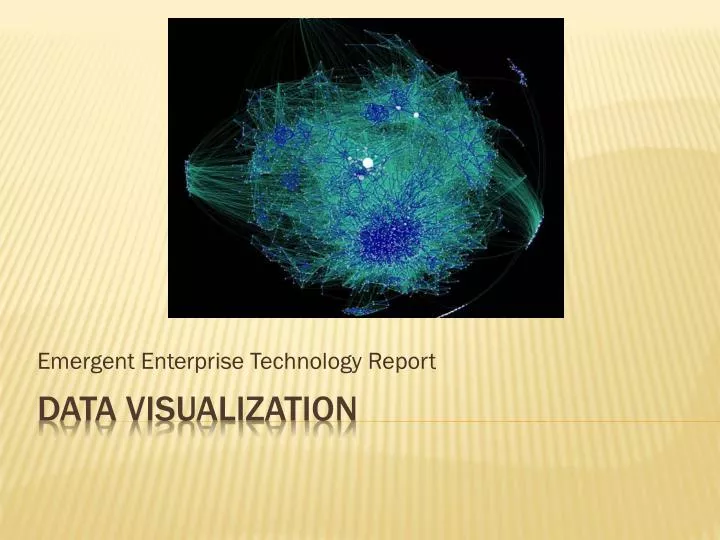
Emergent Enterprise Technology Report Data Visualization
Data Visualization Overview Impact on Organizations Looking Ahead Topic Report
What is it? • Visual Display of Data • Schema • Picture • Chart • Interactive Program Data Visualization Overview • What is the goal? • Communicate Information Clearly & Effectively
Why use it? • Brain is more Receptive to Images • Better & Faster Comprehension • Creates Interest • Less Research Needed Data Visualization Overview
Healthcare Industry • Multi-Slice Scanned View • 1-2 Terabytes per Patient = Data Explosion • Infrastructure Needed • More Effective Treatment Plans Impact on organizations
Now • CAT & MRI Looking Ahead • Future • Virtual Autopsies • Development Stages • 3D View: Rotate, Flip, Twist • Better & Faster than Traditional Autopsies
HealthcareData Visualization Application of Data Visualization Helping, Competitive Advantage, & Society Application Report
Now • Lengthy, Wordy Lab Reports Healthcare Data Visualization • Future • Graphic Displays of Data • Easier to Evaluate • Better Decisions Made
Greater Understanding • Doctors & Patients Application of Data Visualization Diabetes Obesity Diabetes & Obesity Computer Graphics Processing Units + Large Amounts of Data = Meaningful View
Test Results Direct Access Stronger Confidence More Strategic Decision Making Even Practice Surgery! Helping, Competitive Advantage, & Society
Brandy Mayo Brenton Hardwick Curtis Bridges Grant Miller Katherine Maxwell Katherine Smith Kathryn Rigsby Kendall Williams Data VisualizationPresented by Team 3