Download
1 / 22
220 likes | 307 Views
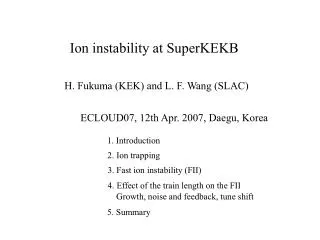
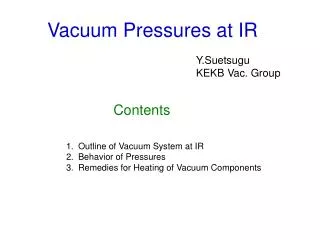
June 14, ‘10 H. Yamaoka. IR stability at SuperKEKB. H. Yamaoka R. Sugahara M. Masuzawa. Introduction. Super KEKB. KEKB. The beam size of Super KEKB is expected to be very small B eam oscillation amplitudes must be kept much smaller than are required at present.

E N D
June 14, ‘10 H. Yamaoka IR stability at SuperKEKB H. Yamaoka R. Sugahara M. Masuzawa
Introduction Super KEKB KEKB The beam size of Super KEKB is expected to be very small Beam oscillation amplitudes must be kept much smaller than are required at present. Large vibration amplitude results in luminosity degradation. In order to evaluate the present vibrations around the IP, Vibration measurements were carried out on the KEKB tunnel floor, on some of the magnets in the interaction region (IR), on magnet supports, on movers and on the Belle detector. Understanding who is shaking. Also reduction of the effects.
? ? ? ? Vibration measurement at KEKB Servo Accelerometer MG-102 Tokkyokiki Corp. • Measurement items • - Vibrations on each positions • Influence of air conditioner • Cooling effects of the magnets • - Coherency between both sides Size 40×40×50mm Max. input ±2G Resolution 1/106G Measure vibrations Acc. 0.1~400HzAcc. 60dB = 1gal/V Coherency between A-B Influence of air conditions B A Air conditioner
On the KEKB-floor (Air conditioner ON/OFF, cryogenic system off) OHO-Perpend. OHO-Beam OHO-UD 68nm 62nm 60nm 40nm 46nm 35nm 10nm 9nm 7nm 7nm 3nm 3nm It seems that frequency around 1-3Hz is a little bit smaller at air-con(OFF)?? →No obvious differences.
Belle detector ~1300tonnes B A Coherency measurement at KEKB-tunnel Coherency between position-A/B. Perpend. Beam dir. Vertical It seems that there is no coherency between two positions. Except for the frequency of microseismic(0.XHz) and resonance of soil(~3Hz).
By Sugahara-san L = 0m X Y Z L = 5m X Y Z 10m 5m 0m L = 10m X Y Z 0.1 1 10 100Hz Measurement: B How is the coherency between two positions? Measure: Distance dependency. - Coherency: >10Hz is getting worse as distance becomes larger. - Vertical dir.: <1Hz is bad.
Measurements during the magnet cooling P.S.D. in the vertical direction ? ? - What happened at 12 o'clock??
- What was happened at 12:00?? Cooling just had been begun. Temperature of Coil Temperature of N2-shield Pressure in the N2 tubes. 10:37 12:37 14:37 16:37 On the N2 tube On the QCS Oscillated Oscillated Oscillations around 1Hzat 12:00 were observed in all directions.
Frequency Response Function (QCS – Floor) Coherency (QCS – Floor) Coherency around 1Hz measured at 12:00 became better than other data.
Vibrations around IR PSD ~8Hz peak Tunnel floor
Amplitudes around IR Amplitude ~8Hz peak Tunnel floor Amplitude in the perpendicular dir. is bigger than others due to peak at 8Hz.
Hammering test Result: Measured mode shape in X-direction 8.4Hz X-dir. What is the motion at 8Hz?? This un-known peak makes large amplitude. Measurement Result: Support system for the magnet (Magnet table + QCS boat) is vibrated with same phase around 8Hz.
- This peak comes from the stiffness of the magnet support. The magnet support structure is mounted on the rails. This is not fixed rigidly. It should be fixed rigidly to eliminate unnecessary gap. Measurement results - First resonance is around ~8Hz. - Amplitude grows bigger. QCS boat Linear guides
Calculations on the QCS-support system QC2RP 1250kg 500kg QC1RE 1370kg 1. Loads - Self-weight - QC1RE: 1370kg - QC2RP: 1250kg - Box: 500kg 2. Materials Cryostat: SUS Coil: Cu Supp.-rod: Ti-alloy QCS table: SS400 QCSboat QCS 3. Thread bolts 10-M30 6-M24 Pre-tension: Not defined Magnet table Fixed Movable table 4. Support-rods(Backward) Spring elements k=6171kg/mm per rod QCSboat 5. Support-rods(Forward) Spring elements k=12521kg/mm per rod Magnet table Cryostat Movable table Coil Respond amplitude due to ground motion is calculated.
Modal calculation 20Hz 10.5Hz 14Hz 44Hz 48Hz 17Hz
QCS-s Coil-s Coil-t QCS-t Response amplitude (Vertical direction)
Response amplitude (Horizontal direction) damping= 0.5% Freq.(Hz) P.S.D.(m2/Hz) 0.1 3e-11 0.3 5e-13 0.4 3e-12 1.0 2e-15 3.0 2e-16 5.5 5e-18 7.5 1e-16 10. 1e-18 20. 1e-18 25. 6e-19 50. 6e-19 100. 5e-21
Conclusion 1. Power Spectrum Density Tunnel: H-dir. ~0.3Hz(Micro-seismic), ~3Hz(Resonancy of soil) V-dir. ~3Hz(Resonancy of soil) Q-table, magnet Peak around 8Hz was measured additionally. 2. Influence of Air conditioner A small difference was measured around 1~3Hz → No obvious differences. 3. Coherency (1) Both sides of KEKB-tunnel (Nikko-side Oho-side) No coherency except for ~0.3Hz and ~3Hz. (2) Distance dependency Frequency above 10Hz is getting worse. 4. Cooling effects There is no big effects to vibration behavior. It occurs at just beginning of the cooling. SP500 Further measurements/plan; - BELLE solenoidal field with immune to magnetic fields(SP500). - Vibration when beam is circulating with SP500. ・Improving the magnet/BELLE/etc support structure. - An orbital FB is needed. No active cancellation system is considered at this point. - We are thinking about something similar to the KEKB iBump system. To next page... Vertical direction tolerance 0.1μm at QC1 ⇒COD of ~ σy at the IP (By Y. Funakoshi)
SuperKEKB iBump systemY.Funakoshi, M.Masuzawa+Magnet group+Monitor group Made by Masuzawa-san. Orbital FB ☆What to monitor to maintain luminosity Beam-beam kick using BPM data. ☆Magnets to move the orbit Vertical & horizontal steering magnets. Probably two systems (1)System for scanning (finding a good collision point) (2)System for maintaining a good collision condition. *The present iBump system does both (1)&(2). ☆Frequency that we deal with < 50 Hz (or 25Hz) ★A practice with one of the iBump magnets will be done in June. “Practice” does not mean actual FB, but to try to see the beam response to the magnet/power supply we have with the monitor group & magnetic field response to power supply.
Integrated amplitudes L: On the QCS L: On the cooling tube Amplitude in the perpendicular is bigger than others due to peak at 8Hz.
Approaches to know vibration behavior 1. P.S.D. (Power Spectrum Density) analysis A PSD is a statistical measure of the response of a structure to random dynamic loading conditions. It is a graph of the PSD value versus frequency, where the PSD may be a displacement PSD, velocity PSD, acceleration PSD, or force PSD. Mathematically, the area under a PSD-versus-frequency curve is equal to the variance (square of the standard deviation of the response). 2. Spectrum (SPRS) analysis A response spectrum represents the response of single-DOF systems to a time-history loading function. It is a graph of response versus frequency, where the response might be displacement, velocity, acceleration, or force. Two types of response spectrum analysis are possible: single-point response spectrum and multi-point response spectrum. Ref.: ANSYS help file Measure ground motion 1. P.S.D. 2. Make R. spectrum Get respond amplitude/stress at each position. Input each data to constraints positions.