Download
1 / 1
10 likes | 112 Views
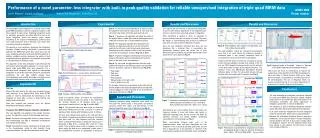
Experimental. Conclusions. QQQ Analyzer. Orthogonal ion source. R 2 > 0.999. R 2 > 0.999. Quad Mass Filter (Q1). Quad Mass Filter (Q3). Octopole. MDMA. Coc. 10KV Dual Dynode Detector. Lens 1 and 2. Collision Cell. Rough Pump. Single 3-stage turbo pump. R 2 > 0.999. R 2 > 0.995.

E N D
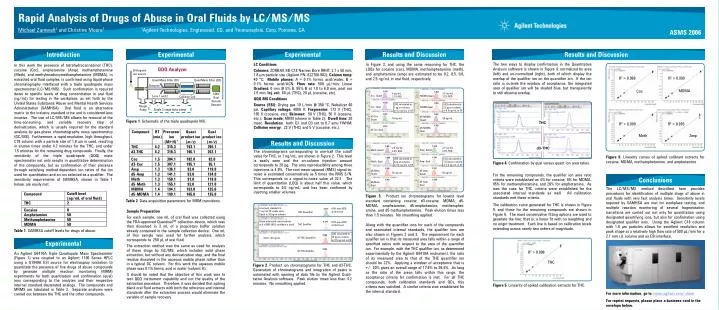
Experimental Conclusions QQQ Analyzer Orthogonal ion source R2 > 0.999 R2 > 0.999 Quad Mass Filter (Q1) Quad Mass Filter (Q3) Octopole MDMA Coc 10KV Dual Dynode Detector Lens 1 and 2 Collision Cell Rough Pump Single 3-stage turbo pump R2 > 0.999 R2 > 0.995 Figure 1. Schematic of the triple quadrupole MS. THC Meth Amp Results and Discussion d3-THC Experimental R2 > 0.998 THC Rapid Analysis of Drugs of Abuse in Oral Fluids by LC/MS/MSMichael Zumwalt1 and Christine Moore21Agilent Technologies, Englewood, CO, and 2Immunaylsis, Corp, Pomona, CA ASMS 2006 Introduction Experimental Results and Discussion Results and Discussion Conclusions Figure 6. Linearity curves of spiked calibrant extracts for cocaine, MDMA, methamphetamine, and amphetamine The two ways to display confirmation in the Quantitative Analysis software is shown in Figure 4, normalized by area (left) and un-normalized (right), both of which display the overlap of the qualifier ion on the quantifier ion. If the ion ratio is outside the window of acceptance, the integrated area of qualifier ion will be shaded blue, but transparently to still observe overlap. Figure 4. Confirmation by qual versus quant ion area ratios. For the remaining compounds, the qualifier ion area ratio criteria were established as 4% for cocaine, 9% for MDMA, 95% for methamphetamine, and 26% for amphetamine. As was the case for THC, criteria were established for the associated internal standards as well. All calibration standards met these criteria. The calibration curve generated for THC is shown in Figure 5, and those for the remaining compounds are shown in Figure 6. The most conservative fitting options are used to generate the line; that is, a linear fit with no weighting and no origin treatment. Each line is based on calibration levels extending across nearly two orders of magnitude. Figure 5. Linearity of spiked calibration extracts for THC. In Figure 3, and using the same reasoning for THC, the LOQs for cocaine (coc), MDMA, methamphetamine (meth), and amphetamine (amp) are estimated to be 0.2, 0.5, 0.6, and 2.5 ng/mL in oral fluid, respectively. Figure 3. Product ion chromatograms for lowest level standard containing cocaine, d3-cocaine, MDMA, d5-MDMA, amphetamine, d5-amphetamine, methamphet-amine, and d5-methamphetamine. Peak elution times less than 1.5 minutes. No smoothing applied. Along with the quantifier ions for each of the compounds and associated internal standards, the qualifier ions are also shown in Figures 2 and 3. The requirement for each qualifier ion is that its measured area falls within a range of specified ratios with respect to the area of the quantifier ion. For example, with the THC qualifier ion, as determined experimentally by the Agilent G6410A instrument, the ratio of its measured area to that of the THC quantifier ion should be 22%. Applying a window of acceptance that is +/- 20% gives an overall range of 17.6% to 26.4%. As long as the ratio of the areas falls within this range, the acceptance criteria for confirmation is met. For all THC compounds, both calibration standards and QCs, this criteria was satisfied. A similar criteria was established for the internal standard. LC Conditions Columns: ZORBAX SB-C18 Narrow Bore RRHT, 2.1 x 50 mm, 1.8 µm particle size (Agilent PN: 822700-902); Column temp: 40 °C; Mobile phases: A = 0.1% formic acid/water, B = 0.1% formic acid/ACN; Flow rate: 500 µL/min; Linear Gradient: 0 min @ 5% B, 95% B at 1.0 to 6.0 min, post run 2.5 min; Inj. vol: 80 µL (THC), 20 µL (cocaine, etc). QQQ MS Conditions Source (ESI): Drying gas 10 L/min @ 350 °C, Nebulizer 40 psi, Capillary voltage: 4000 V; Fragmentor: 173 V (THC), 165 V (cocaine, etc); Skimmer: 58 V (THC), 50 V (cocaine, etc.); Scan mode: MRM (shown in Table 2); Dwell time: 20 msec. Resolution: both Q1 and Q3 set to 0.7 amu FWHM; Collision energy: 23 V (THC) and 5 V (cocaine, etc.). The chromatograms corresponding to one-half the cutoff value for THC, or 1 ng/mL, are shown in Figure 2. This level is easily seen and the on-column injection amount corresponds to 20 pg. The area reproducibility among three injections is 4.9%. The root-mean-squared (RMS) signal-to-noise is estimated conservatively as 5 times the RMS S/N. This corresponds to a signal-to-noise value of 32:1. The limit of quantitation (LOQ) is about half this value, which corresponds to 0.5 ng/mL, and has been confirmed by injecting smaller volumes. In this work the presence of tetrahydrocannabinol (THC), cocaine (Coc), amphetamine (Amp), methamphetamine (Meth), and methylenedioxymethamphetamine (MDMA), in extracted oral fluid samples, is confirmed using liquid-phase chromatography interfaced with a triple quadrupole mass spectrometer (LC/MS/MS). Such confirmation is required down to specific levels of drug concentration in oral fluid (ng/mL) for testing in the workplace, as set forth by the United States Substance Abuse and Mental Health Services Administration (SAMHSA). Oral fluid is an alternative matrix to the industry standard urine and is considered less invasive. The use of LC/MS/MS allows for removal of the time-consuming, and variable recovery step of derivatization, which is usually required for the standard analysis by gas-phase chromatography mass spectrometry (GC/MS). Furthermore, a rapid-resolution, high throughput, C18 column with a particle size of 1.8 um is used, resulting in elution times under 4.2 minutes for the THC, and under 1.5 minutes for the remaining drug compounds. Finally, the sensitivity of the triple quadrupole (QQQ) mass spectrometer not only results in quantitative determination of the compounds, but as confirmation of their presence through satisfying method-dependent ion ratios of the ion used for quantitation and an ion selected as a qualifier. The sensitivity requirements of SAMHSA, shown in Table 1 below, are easily met. 1.472 1.353 2.5 ng/mL 3.2% RSD 4 ng/mL 2.1% RSD Coc. Quant MDMA Quant 1.470 1.353 LOQ calculated at 2.5 pg on-column, or 0.5 ng/mL in OF LOQ calculated at 1 pg on-column, or 0.2 ng/mL in OF Coc. Qual MDMA Qual 1.472 1.352 d3-Coc Quant d5-MDMA Quant 50 ng/mL 16 ng/mL 1.352 1.473 d5-MDMA Qual d3-Coc Qual 1.346 1.319 2.5 ng/mL 5.8% RSD 2.5 ng/mL 4.9% RSD Amp. Quant Meth. Quant 1.318 1.348 LOQ calculated at 12.5 pg on-column, or 2.5 ng/mL in OF LOQ calculated at 3 pg on-column, or 0.6 ng/mL in OF Amp. Qual Meth. Qual 1.317 1.345 d5-Meth. Quant d5-Amp. Quant 50 ng/mL 50 ng/mL 1.318 1.344 d5-Amp. Qual d5-Meth. Qual The LC/MS/MS method described here provides procedures for identification of multiple drugs of abuse in oral fluids with very fast analysis times. Sensitivity levels required by SAMHSA are met for workplace testing, and multiple reaction monitoring of several fragmentation transitions are carried out not only for quantitation using designated quantifying ions, but also for confirmation using designated qualifier ions. Using the Agilent C18 column with 1.8 µm particles allows for excellent resolution and peak shape at a relatively high flow rate of 500 µL/min for a 2.1 mm i.d. column and an ESI interface. Table 2. Data acquisition parameters for MRM transitions. Low level standard at 1 ng/mL OF easily seen. Equal to 20 pg on-column. 4.9% area RSD at this level 4.171 Sample Preparation For each sample, one mL of oral fluid was collected using the FDA-approved QuantisalTM collection device, which was then dissolved in 3 mL of a proprietary buffer solution already contained in the sample collection device. One mL of this sample was used for further analysis, which corresponds to 250 µL of oral fluid. The extraction method was the same as used for analysis of these drugs by GC/MS, which includes solid phase extraction, but without any derivatization step, and the final residue dissolved in the aqueous mobile phase rather than in a typical GC solvent. For this work the aqueous mobile phase was 0.1% formic acid in water (solvent A). It should be noted that the objective of this work was to test QQQ instrument capability and not the quality of the extraction procedure. Therefore, it was decided that spiking blank oral fluid extracts with both the reference and internal standards after the extraction process would eliminate the variable of sample recovery. THC Quantifier Noise estimated conservatively at 5 x RMS (95% confidence level) 8.6% area RSD at this level 4.174 THC Qualifier Table 1. SAMHSA cutoff levels for drugs of abuse. LOQ calculated at 10 pg on-column, or 0.5 ng/mL in OF 4.166 d3-THC Quantifier IStd = 40 ng/mL 4.163 d3-THC Qualifier An Agilent G6410A Triple Quadrupole Mass Spectrometer (Figure 1) was coupled to an Agilent 1100 Series HPLC using a G1948A ESI source for electrospray ionization to quantitate the presence of five drugs of abuse compounds by generate multiple reaction monitoring (MRM) experiments for both quantitation and confirmation (qual) ions corresponding to the analytes and their respective internal standard deuterated analogs. The compounds and MRMS are tabulated in Table 2. Separate analyses were carried out between the THC and the other compounds. Figure 2. Product ion chromatograms for THC and d3-THC. Generation of chromatograms and integration of peaks is automated with opening of data file by the Agilent Quali-tative Analysis software. Peak elution times less than 4.2 minutes. No smoothing applied. For more information, go to www.agilent.com/chem For reprint requests, please place a business card in the envelope below.