Download
1 / 21
210 likes | 315 Views
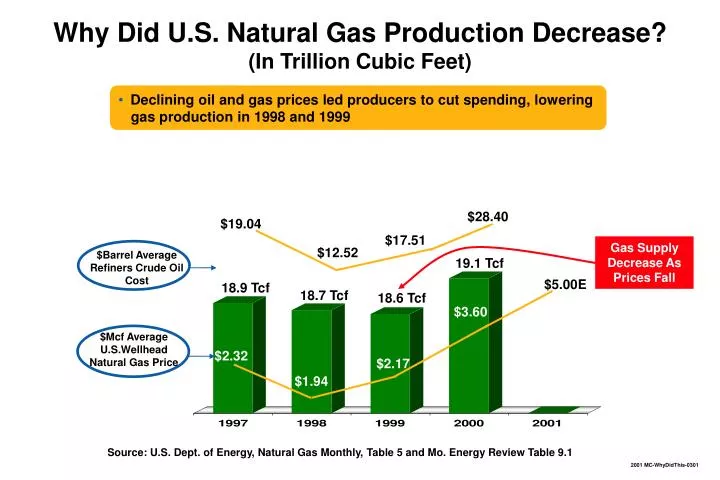
Why Did U.S. Natural Gas Production Decrease? (In Trillion Cubic Feet). Declining oil and gas prices led producers to cut spending, lowering gas production in 1998 and 1999. $28.40. $19.04. $17.51. Gas Supply Decrease As Prices Fall. $12.52. $Barrel Average Refiners Crude Oil Cost.

E N D
Why Did U.S. Natural Gas Production Decrease? (In Trillion Cubic Feet) • Declining oil and gas prices led producers to cut spending, lowering gas production in 1998 and 1999 $28.40 $19.04 $17.51 Gas Supply Decrease As Prices Fall $12.52 $Barrel Average Refiners Crude Oil Cost 19.1 Tcf $5.00E 18.9 Tcf 18.7 Tcf 18.6 Tcf $3.60 $Mcf Average U.S.Wellhead Natural Gas Price $2.32 $2.17 $1.94 Source: U.S. Dept. of Energy, Natural Gas Monthly, Table 5 and Mo. Energy Review Table 9.1
Why Are U.S. Natural Gas Prices So High? This natural gas demand increase occurred when domestic supplies fell: a. during a U.S. gas production downturn b. in a period when overall U.S. gas demand increased 6.2% c. when gas demand by industrials and non-utility power generators increased 5.5% d. in a market where natural gas in storage fields was 33% below normal e. in a market where supplies were tight which resulted in natural gas prices increasing by over 200%
Why Did U.S. Natural Gas Prices Skyrocket? (In Dollars per Thousand Cubic Feet) • When gas demand exceeded supplies gas prices increased over 200% $4.61 $3.70 $2.55 $2.50 $2.15 $1.86 $1.85 $2.12 $2.18 $2.08 $1.95 $1.84 Jan April July Oct. 1999 Jan April July Oct. 1998 Jan April July Oct. 2000 Source: U.S.DOE EIA Natural Gas Monthly, Table 4
Why Did This Winter’s Natural Gas Use Increase by 15%? (In Trillion Cubic Feet) 15% 2.556 2.212 • This November/December was the coldest winter period on record since 1895! Source: U.S. DOE Natural Gas Monthly, 12/00, Table 3 and NOAA, 1/5/01
Why Did U.S. Natural Gas Demand Increase? (In Trillion Cubic Feet) • GDP growth above 4% coupled with lower natural gas and oil prices increased gas demand by industrial users and non-utility power generators since 1998 by 6.2% 22.6 21.9 21.7 21.2 Industry & Non-Utility Power Generation 8.8 9.3 9.0 8.6 2.9 3.1 2.9 Utility Power Generation 3.2 3.2 3.4 Commercial 3.0 3.0 Residential 5.0 4.7 5.0 4.5 Pipeline and Gas Plant Fuel 2.0 1.9 2.0 1.9 2000 1999 1998 1997 U.S. GDP Growth/Yr: 4.3% 4.6% 5.0% 3.4% Source: U.S., DOE Natural Gas Monthly
Key Combustion Turbines Combined Cycle Why Are So Many Gas Fired Power Plants Being Planned in the U.S.? (In Gigawatts) 226.3 • 226 Gigawatts of combined cycle plants are being planned in the U.S. • About 1/3 of these plants are combustion turbines for peaking • Low capital costs and clean energy 70.2 66.7 53.3 22.4 13.7 2002 2004 2000 2001 2003 Total Source: Energy Ventures Analysis, Inc. 9/2000 MC-USPipelineTrans-0201
U.S. Natural Gas Storage Levels Are 33% Below Normal (In Trillion Cubic Feet) • Current gas in storage levels is below year ago levels. Additional storage filling is needed to replace this supply in time for next winter 1.019 33% Current Working Gas In Storage .688 5-Year Average Gas in Storage Today Source: Gas Daily, March 2001
Why Can’t Gas Customers Protect Themselves From Paying These High Gas Prices? • Big customers can protect themselves directly and small consumers can protect themselves through their LDCs Industrial / Large Commercial Customers • Use hedging tools to manage your gas price exposure in a rising gas price market • Use energy services companies to manage your fuel supply & for energy conservation • Use weather derivative products to protect your gas price exposure to weather extremes • Use gas contract portfolio purchasing on a term, not spot, basis to obtain more stable prices • Petition your Public Utility Commission to allow your gas LDC to use price hedging tools and weather derivatives to cap skyrocketing prices Residential / Small Commercial Customers Served by Local Distribution Companies (LDC)
Why Will Natural Gas Supplies Increase? +0.9% -1.0% -3.0% -1.8% +1.7% +2.9% E 565 562 494 719 850 900 E 18.903 18.708 18.146 17.863 18.115 18.643 E 1997 1998 1999 2000 2001E 2002E 2003E Average No. of Gas Rigs Growth as %/yr U.S. Production Trillion Cubic Feet Year Change in Production is up Production’s Going Up Drilling is up Source: DOE Monthly Energy Review and Lehman Brothers Estimates, 3/21/01
Why Did California’s Electricity Situation Go From Normal to Shortfall? High gas prices for power plant fuel High demand exceeds supplies Out of state power exports cutback Slow to add new power plants Set Up Rigid Mandatory Supply Pool w/ No Long Term Contracting
Electricity use grows • Installed capacity has gone down 1,228 MW since 1997 as only 525 MW were added--compared to 1753 MW shut down 53,884 53,742 53,555 52,656 Electricity capacity falls 1999 2000 1997 1998 Why Has Electricity Demand Growth in California Outpaced Electricity Generation Capacity? (In Megawatts) Source: California Energy Commission
7,859 5,147 3,141 1,028 Entergy LA/GA SERC California/ WSCC PA/NJ/MD ECAR U.S. NERC Region Average How Much New Power Generation Capacity Under Construction? (In Megawatts) • California is slow to add future new power generation capacity compared to other U.S. regions
U.S. GDP Average California GDP Average California’s Economic Growth Has Outpaced the U.S. GDP Average (GDP in Real 1999 Dollars) 8.7% 6.0% 5.6% 5.0% 4.6% 4.5% 4.3% 3.4% 2000 1999 1997 1998 Source: California Dept. of Commerce, 3/15/01 and U.S. Dept. of Commerce
U.S. Electricity Demand Growth California Electricity Growth California’s Electricity Demand Growth Has Outpaced the U.S. Average Growth • California’s electricity demand growth has been at twice the U.S. growth rate since 1998 • This is due to the higher California GDP growth rate which surged since 1998 9.0% 4.9% 4.0% 3.4% 3.0% 1.3% 1.6% 0% 2000 1999 1997 1998 Source: U.S. DOE EIA, Mo. Energy Review Table 7.5 and U.S. Dept. of Commerce
Supply Capacity Electricity Demand Why Does California Have an Electricity Supply Shortage? • Last year when peak electricity demand in California was 52,000 Megawatts, it exceeded peak supply capacity, which has been falling 54 53 53 Surplus 52 52 52 52 51 Shortfall 2000 1999 1997 1998 Source: U.S. DOE EIA, Electric Power Monthly and California Energy Commission
Why are NYMEX Electricity Futures Pricesfor California so High versus Other Markets? $505 California Border $455 $405 $380 $365 $365 $325 $315 $285 • High Demand vs. tight Supply • Flawed pool method sets high spot prices • Slow to add new power plants • High gas prices • Reduced imports of electricity from out of state $122 $122 Calif/Oregon Entergy LA/GA Penna NJ/MD $112 $112 $81 $74 $52 $48 $50 $46 $46 $46 $46 $49 $42 $42 $42 $44 Apr. May June July Aug. Sept. Oct. Nov. Dec. 2001 Source: Megawatt Daily, NYMEX Prices, 3/23/01
Why Does California Use So Much Gas for Power Generation? Is California’s Fuel Use in Power Plants Less Efficient Than the U.S. Average? (In BTU’s per KWH) 14,425 Heat Rate of Fossil Fuels Electric Utility Generation in California Consumes 40% More Fuel and is less efficient than U.S. Average 40% 10,360 10,506 10,264 9,883 9,751 FL U.S. Average California NY TX LA Source: 1999 EEI Statistical Yearbook, Table 26
California’s Imports of Electricity from other Western States Swings Widely (In Megawatts) • Day to day changes in import volumes can be 60% or more 4934 4917 60% Drop 1855 Source: CAL ISO, 2001 Peak Resources Plan and Press Release, 4/5/01
The Economics of Gas-Combined Cycle Plants versus Coal-Fired Plants Favor Gas Pulverized Coal Low Gas Cost Combined Cycle Higher Gas Cost Combined Cycle 65% $1,300 2,847 3.53 0.41 0.34 1.08 65% $545 2,847 1.48 0.27 0.10 3.16 65% $545 2,847 1.48 0.27 0.10 1.58 % Utilization Capital cost installed Generation per year 1000 MWH Capital costs ¢KWH Other Fixed Costs ¢KWH Variable Costs ¢KWH Levelized Fuel Cost ¢KWH * 5.36¢KWH 3.43¢KWH Total Annual Cost 5.01¢KWH * Coal at $1.15 MMBTU and gas at $2.28 in low cost case and $4.56 in higher cost case Source: ICF Consulting, Oct. 1999
How Environmentally Clean Are The More Efficient Natural Gas Combined-Cycle Power Plants? 81% Lower Nitrogen Oxides 58% Lower Carbon Dioxide 100% Less Ash and Sludge 100% Lower Sulphur Dioxide 8043 5056 475,000 2.9 MM Tons per year 971 1.2 MM 7 0 Gas Combined Cycle Gas Combined Cycle Gas Combined Cycle Gas Combined Cycle Advanced Coal Advanced Coal Advanced Coal Advanced Coal Source: U.S. EPA and American Gas Association
How Will Other States Avoid the Problems that California Encountered? Allow Utilities to Hedge Power Prices and Use of Longer Term Contracting for Price Risk Management Avoid Regulated Price Caps and Allow Incentives for Customers to Adjust Electricity Use up or Down to Reflect the Price of Producing Electricity Expedite the Time it Takes to Add New Power Plants and Monitor Supply & Demand Carefully Allow Utilities to Negotiate Power Deals Direct With Third Parties and Make any Pool Optional Avoid a Mandatory Power Pool With Rigid Spot Power Pricing Setting Provide a Competitive Market Place