Download
1 / 15
150 likes | 292 Views
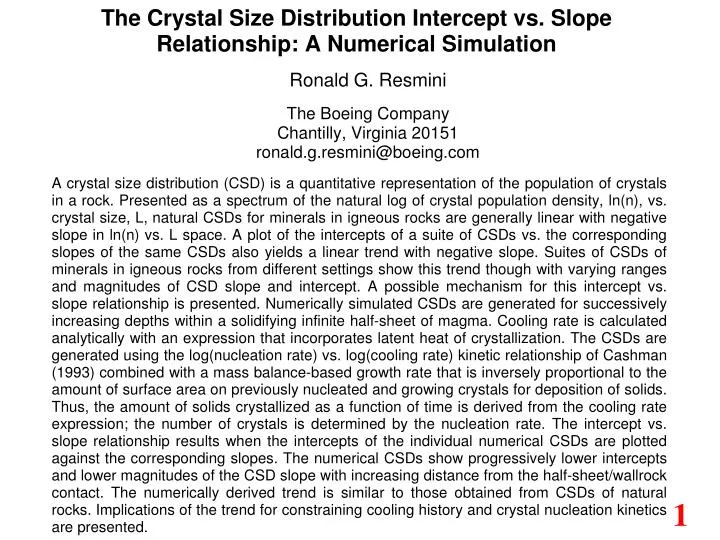
A Typical CSD. AT-67. 14.0. 12.0. 10.0. 8.0. ln(n) (no./cm 4 ). 6.0. 4.0. 2.0. 0.0. 0.0. 0.5. 1.0. 1.5. 2.0. L (mm). A CSD of plagioclase in a high-alumina basalt from Atka Island, Alaska, from Resmini (1993). CSDs may be characterized by their slope and

E N D
A Typical CSD AT-67 14.0 12.0 10.0 8.0 ln(n) (no./cm4) 6.0 4.0 2.0 0.0 0.0 0.5 1.0 1.5 2.0 L (mm) A CSD of plagioclase in a high-alumina basalt from Atka Island, Alaska, from Resmini (1993). CSDs may be characterized by their slope and intercept. Numerous CSDs from a suite of samples may be represented as points on a plot of CSD intercept vs. slope as shown next (pl. 3).
The CSD Intercept vs. Slope Relationship 20.0 17.5 Dome Mountain, NV (plagioclase) 15.0 Atka, AK (plagioclase) Intercept (no./cm4) 12.5 10.0 Crater Flat, NV (olivine) 7.5 5.0 -20.0 -15.0 -10.0 -5.0 0.0 Slope (mm-1) Intercept and slope values for numerous CSDs (from Resmini, 1993). Note the linear trends. The modal abundance of plagioclase in the Dome Mtn. rocks is ~6.5 vol.%.
(of the liquid) Method • Build CSDs for increasing distances from the contact of theJaeger (1957) infinite-half sheet of magma (a sill proxy) (eq. 1);CSDs generated for 1, 5, 50, 100, and 500 meters from contact • Use the Cashman (1993) nucleation rate, I, expression (eq. 2) • Crystal growth rate, G, is by the “Distribution of Mass” method(see next slide) Cooling rate expression from Jaeger (1957) for an infinite half-sheet of magma: eq. 1 Crystal nucleation rate (I) relation of Cashman (1993): eq. 2 Symbols and values are given in the Symbol Table, below.
Method Growth Rate By “Distribution of Mass”
Method CSDs are thus generated for various positions within an infinite half-sheet of magma. All CSDs are calculated assuming complete solidification (i.e., 100% solids). From each CSD, the slope and intercept parameters are extracted and subsequently plotted.
ln(n) L ln(n) L Intercept ln(n) L Slope ln(n°) Intercept Wallrock ln(n) Contact Slope L (mm) 2 Infinite Half-Sheet of Magma 3 1 Magma
Results: CSDs Generated From The Model 50 Meters 5 Meters ln(n), no./cm4 ln(n), no./cm4 L (mm) L (mm) Typical model CSDs and a table of all CSD parameters.
Typical Model CSD Evolution The CSD Located 5 Meters From the Contact 18 20 16 19 Values refer to percent solids. 18 14 17 12 CSD Intercept, no/cm4 16 ln(n), no/cm4 10 y = 1.1737Ln(x) + 13.37 15 8 2 R = 0.9954 100% 14 6 10% 13 4 5% 50% 12 2 0.0 0.2 0.4 0.6 0.8 1.0 1.2 0 20 40 60 80 100 L (mm) Percent Solids The evolution of the CSD located 5 m from the sill contact. Note that CSD slope is constant throughout the solidification interval and that CSD intercept evolves vs. percent solids as shown. This behavior is important to note because in subsequent plates, model results for 100% solids will be compared to natural CSDs calculated for minerals with significantly lower modal abundances.
The CSD Intercept vs. Slope Relationship 20.0 Model CSDs 1 m 5 m 17.5 100 m 50 m 15.0 500 m Intercept (no./cm4) 12.5 Atka, AK Dome Mountain, NV 10.0 7.5 Crater Flat, NV 5.0 -20.0 -15.0 -10.0 -5.0 0.0 Slope (mm-1) The plot of plate 3 now with the model CSDs included. The modal abundance of plagioclase in the Dome Mtn. rocks is ~6.5 vol.% whereas the model CSDs are for 100% solids. The model CSDs define a trend similar to that of the natural CSDs.
Offset of Model CSD Trend Due to Higher Modal Abundance 20.0 Model CSDs 17.5 15.0 Intercept (no./cm4) Constant CSD Slope Increasing Time 12.5 Increasing % Solids 10.0 7.5 5.0 -20.0 -15.0 -10.0 -5.0 0.0 Slope (mm-1) As indicated in plate 9, a CSD evolves throughout the solidification interval with constant slope. Thus, a point on a plot of CSD intercept vs. slope evolves in time (i.e., as a function of increasing % solids) by “moving” vertically along the intercept axis, as shown. Intercept value maps modal abundance.
Discussion • The model intercept vs. slope trend shows concavity; the natural sampletrends are apparently linear. The scatter inherent in the natural data maybe masking a curved trend. • Though not shown here, different values of I’ and m in eq. 2 of plate 4 willyield suites of CSDs with trends different from that shown in plate 10.Thus, the definition of intercept vs. slope trends for suites of samplesmay constrain nucleation rate kinetic parameters. • The intercept vs. slope trend of the model CSD data indicates that loweroverall CSD intercepts and low absolute values of the slope are due tolonger, slower cooling. • Thus, in addition to providing information on nucleation kinetics, the CSDintercept vs. slope relationship for a suite of samples may bound coolingtimes. Such bounds may then be related to magmatic system size.
Acknowledgements Partial funding for this work provided by The Boeing Company. References Additional Information Pre-prints of a manuscript currently in review at the Journal of Volcanology and Geothermal Research are available below.