Download
1 / 56
570 likes | 706 Views
THE TOTAL INSTALLED GENERATION CAPACITY OF TAMIL NADU AS ON 30.04.2009. RENEWABLE OR NON-CONVENTIONAL ENERGY SOURCES. INSTALLED CAPACITY AND PERCENTAGE OF INSTALLED CAPACITY AS ON 30.04.09. PROPOSED CAPACITY ADDITION DURING 2009-10. in MW. PROPOSED CAPACITY ADDITION DURING NEXT 5 YEARS.

E N D
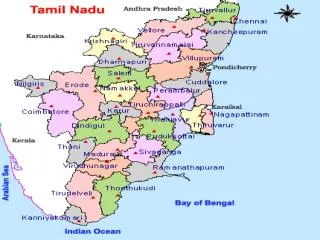
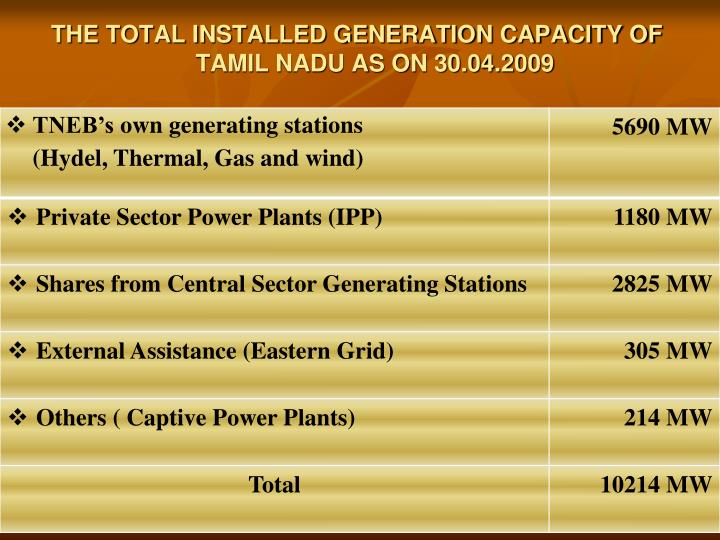
THE TOTAL INSTALLED GENERATION CAPACITY OF TAMIL NADU AS ON 30.04.2009
INSTALLED CAPACITY AND PERCENTAGE OF INSTALLED CAPACITY AS ON 30.04.09
PROPOSED CAPACITY ADDITION DURING 2009-10 in MW
PROPOSED CAPACITY ADDITION DURING NEXT 5 YEARS in MW
PROPOSED CAPACITY ADDITION DURING 2009-10 - Central Sector
PROPOSED CAPACITY ADDITION DURING 2009-10 - State Sector
PROPOSED CAPACITY ADDITION DURING 2010-11 - Central Sector
PROPOSED CAPACITY ADDITION DURING 2010-11 - State Sector
PROPOSED CAPACITY ADDITION DURING 2011-12 - Central and State Sector
PROPOSED CAPACITY ADDITION DURING 2012-13
PROPOSED CAPACITY ADDITION DURING 2013-14
PROPOSED CAPACITY ADDITION DURING 2014-15
230 KV Lines to be Executed by TNEB for 230/33 KV SS to be Executed by MPP -2011-12
230 KV Lines to be Executed by TNEB for 230/33 KV SS to be Executed by MPP -2011-12 – Contd.
Investment Required for Power Evacuation System During Next Five Years Rs Cr
Investment Required for Transmission Schemes For Next Five Years
TRANSMISSION FIXED ASSETS VALUE AS ON 31.03.2008 (Rs.inCrores) GROSS ASSETS : Rs. 6017.42 DEPRICIATION : Rs. 2333.38 NET VALUE : Rs. 3684.04
AVENUES FOR INVESTMENTS • Permitting private operator on “Build, Own Operate and Maintain” basis • Joint venture with private operators • Joint venture with financial institutions • Funding by financial institutions
Permitting private operatorADVANTAGES • Selection through competitive bidding • Total risk of completion/execution of project rests with the operator • Total risk of availability lies with the operator • Deployment of technology and expertise possible
PROCEDURES FOR SELECTION OF PRIVATE OPERATORS • Identify the project • Selection of developers thro’ Tariff based competitive bidding. • Appoinment of BPC • Short listing thro’ RFQ • Signing of TSA
PROCEDURES FOR SELECTION OF PRIVATE OPERATORS- Cont. • Monthly transmission charges – Escalable charges and non – escalable charges • Incentive - For availability of above 98% • Penalty - For availability of less than 95%
JOINT VENTURE WITH PRIVATE OPERATORS ADVANTAGES • Increased requirement of equity can be met through the investor • Possible to get technology and expertise DISADVANTAGES • Finding a private operator - cumbersome process • Possibility of mutual conflict • Cost of capital likely to be high
DISADVANTAGES • Likely to be a costlier option • Utilities continue to pay for 25 years at the escalated rate • No buy back • Flexibility for transmission utility absent
JOINT VENTURE WITH FINANCIAL INSTITUTIONS ADVANTAGES • Increased requirement of equity can be met through the investor • Easy to find partner DISADVANTAGES • Possibility of mutual conflict • Cost of capital likely to be high • Likely conditionalities
FUNDING BY FINANCIAL INSTITUTIONS ADVANTAGES • The cost of capital is the least • Less conditionalities • Full exploitation of available expertise • Ensure continuous growth of utility DISADVANTAGES • Mustering equity • Ability to complete the project on time • Ability to maintain availability
FEASIBILITY OF EXECUTION BY THE UTILITY PREREQUISITES • Financial Capability • Technical Capability • Administrative Capability
FINANCIAL CAPABILITY Assumptions Gross asset as on 31/03/08 : Rs 6017 Crs Equity (30%) : Rs 1805 Crs Outstanding Loan : Rs 1878 Crs ROE (17.48%) : Rs 315 Crs Investment from 2009-10 taken separately