Download
1 / 3
30 likes | 160 Views
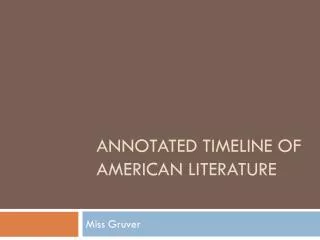
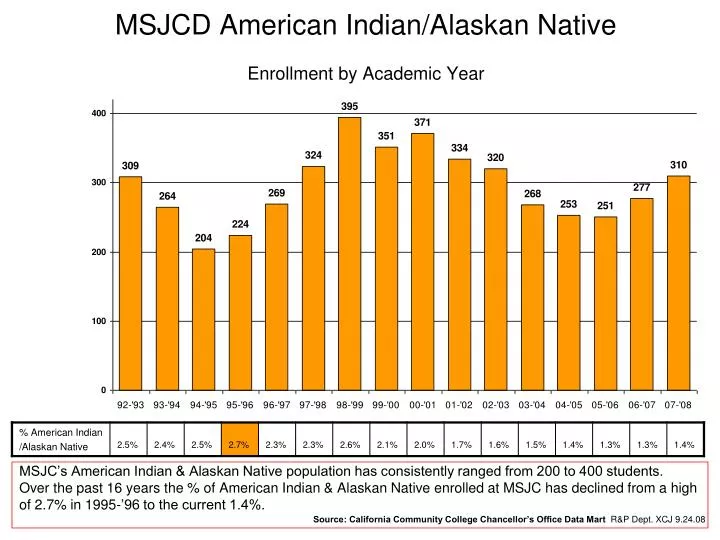
MSJCD American Indian/Alaskan Native Enrollment by Academic Year. MSJC’s American Indian & Alaskan Native population has consistently ranged from 200 to 400 students. Over the past 16 years the % of American Indian & Alaskan Native enrolled at MSJC has declined from a high

E N D
MSJCD American Indian/Alaskan NativeEnrollment by Academic Year MSJC’s American Indian & Alaskan Native population has consistently ranged from 200 to 400 students. Over the past 16 years the % of American Indian & Alaskan Native enrolled at MSJC has declined from a high of 2.7% in 1995-’96 to the current 1.4%. Source: California Community College Chancellor’s Office Data Mart R&P Dept. XCJ 9.24.08
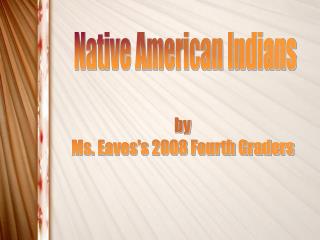
Financial Assistance Provide MSJCD American Indian/Alaskan Native Fee Waivers Loans Grants Scholarships Fed Work Study MSJC’s American Indian & Alaskan Natives students received $185,705 in financial assistance in AY 2006-’07 Source: California Community College Chancellor’s Office Data Mart R&P Dept. XCJ 9.24.08
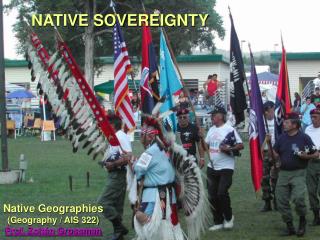
Success Rate* MSJC Spring 2008 The American Indian & Alaskan Natives’ Success & Retention Rates are below the average. Retention Rate* *Success rate = A, B, C or CR grades divided A, B, C, CR, D, F, NC, I & W; Retention Rate = A,B,C,CR, D, F, NC & I grades divided by A, B, C, CR, D, F, NC, I & W Source: California Community College Chancellor’s Office Data Mart R&P Dept. XCJ 9.24.08