Download
1 / 30
300 likes | 436 Views
Practical Geological Application of Fourier Theory . Japan Earthquake 3/11/2011. Climate and Milankovich Cycles. Japan Earthquake 3/11/2011. Earthquake Wave Types. Earthquake Wave Propagation. http://neic.usgs.gov/neis/eq_depot/2002/eq_021103/ak_seismic_waves.html

E N D
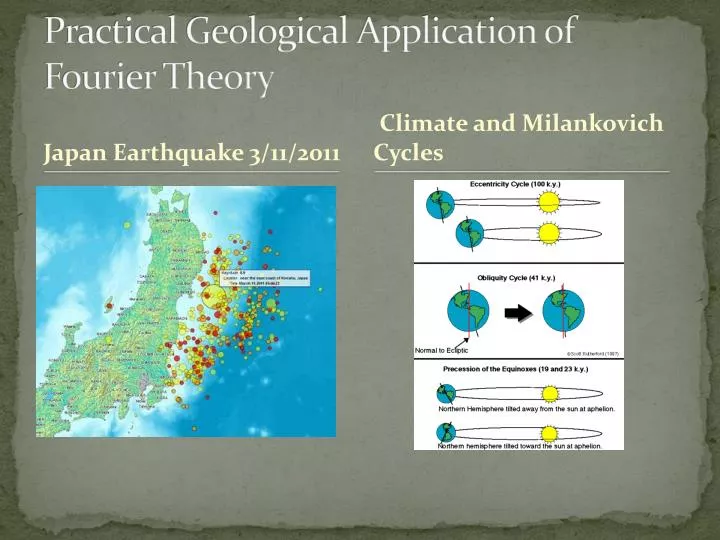
Practical Geological Application of Fourier Theory Japan Earthquake 3/11/2011 Climate and Milankovich Cycles
Earthquake Wave Propagation • http://neic.usgs.gov/neis/eq_depot/2002/eq_021103/ak_seismic_waves.html • http://www.britannica.com/EBchecked/topic/176199/earthquake/247991/The-study-of-earthquakes
Japan Earthquake 3/11/2011, Original seismic wave signature recorded from Cincinnati Ohio 3/11/2011 Arrive time 12:59:27.5 am EST Start time 12:00 am EST P-Wave Noise S-Wave Rupture time 12:46 am EST Love Rayleigh
Joseph Fourier Joseph’s basic idea: “it is possible to form any function f(x) as a summation of a series of sine and cosine terms of increasing frequency. In other words, any space or time varying data can be transformed into a different domain called the frequency space”. How and an example?
P-Wave : Frequency vs Amplitude Low cut freq High cut freq
Fourier Transform of Japan Earthquake Seismic Data Live Demonstration
What does the data mean? • The data from the earthquake has been “transformed” where one may see the frequency and the amplitude of each wave from the original data series. • This information can then be broken down, filtered, to better understand and isolate a series of respective waves. • This filtering is accomplished by either a low band pass or a high band pass filter depending on the waves of interest. • Once the respective wave frequency is filtered and graphed then a series of conclusions can be made and explained in regards to the wave frequency in question.
What are Milankovich Cycles? • Milankovich Cycles are collective effects of changes in the earth’s movements upon its climate. • These effects are brought about by 3 specific cycles based on time, orbit and rotation of the earth: • Eccentricity which occurs every 100,000 years • Axial tilt which occurs every 41,000 years • Precession which occurs every 23,000 years
Climate data analyzed Oxygen 18 isotopes gathered from Foraminifera skeletal remains
Example of Pacific Ocean climate data ran through a Fourier Transform and plotted as a spectrum of frequencies and their relative response
What does the data mean? • The data that was obtained, transformed, plotted, and analyzed as displayed on the previous slide can be used to support or disprove theories such as those relating to the Milankovich Cycles: eccentricity, axial tilt , and Precession. • In order to use the information to support or disprove a point or idea filters can be run on raw data to isolate and select for specific points to help to this end. • This is accomplished by using different band passes based on where the points of interest reside, high pass high frequency or low pass low frequency, or where further investigation is needed and thereby eliminating all unnecessary points.
Data Correlation By comparing the d18 filter values from the Pacific Ocean and Caribbean Sea, we can determine if they correlate with one another. The colored lines plot the data, filtered to bring out variations related to eccentricity, over the original data.
Correlation Chart The two data sets appear to correlate, indicating that eccentricity variation affected both regions, which supports the hypothesis that orbital eccentricity affects global climate significantly
Using Goldwave Audio software This is the “sound” of the 7.3 Landers Earthquake of 1992, recorded in the Long Valley Caldera. The “sound” was recorded by placing a speaker at the site and letting the earthquake shake it. Amplitude Time (s)
Frequency Spectrum High Frequencies Low Frequencies The horizontal axis shows frequencies, increasing from left to right The vertical axis essentially shows how often a frequency appears This box shows the range of frequencies in this sound. In other words, this wave consists of many different waves of varying frequencies, and the Fourier Transform allows these frequencies to be seen.
Applying a High Pass Filter • By instructing Goldwave to apply a high pass filter to the sound waves, all frequencies lower than the arbitrarily set cutoff of 1000Hz were removed. The image below shows the result. • Because so little is left of the original sound, it is clear that almost all of the waves were low frequency in nature Amplitude Time (s)
Conclusions • Fourier transforms are applications that can help analyze large or small data sets based on space or time in relation to sine and cosine waves. Which makes Fourier transforms valuable for geologic applications. • By understanding the process one is better able to understand the data being analyzed and key in on data points that may have been difficult to isolate other wise. • Key point is to keep in mind what the data is telling and what the data is not telling. It is easy to manipulate the data to “fit” and support an idea that may not be true.
Audio Editing software such as Goldwave can be used in a manner similar to Psi-Plot, but using sound instead of raw numbers. • But, unlike Psi-plot, it enables the user’s mind to understand the components of a wave in another sense—sound. • Source: USGS via Geology.com http://geology.com/usgs/earthquake-sounds/
These efforts were supported through Halliburton Foundation Scholarships to explore Spectral Decomposition Concepts at the Undergraduate and Graduate Level
Cited Works: • deschutes.gso.uri.edu • webmail.jhuccp.or.id • www-history.mcs.st-and.ac.uk • soer.justice.tas.gov.au • atlasobscura.com • Tutorial on Fourier Theory by Yerin Yoo, March 2001. p.1.