Download
1 / 26
260 likes | 365 Views
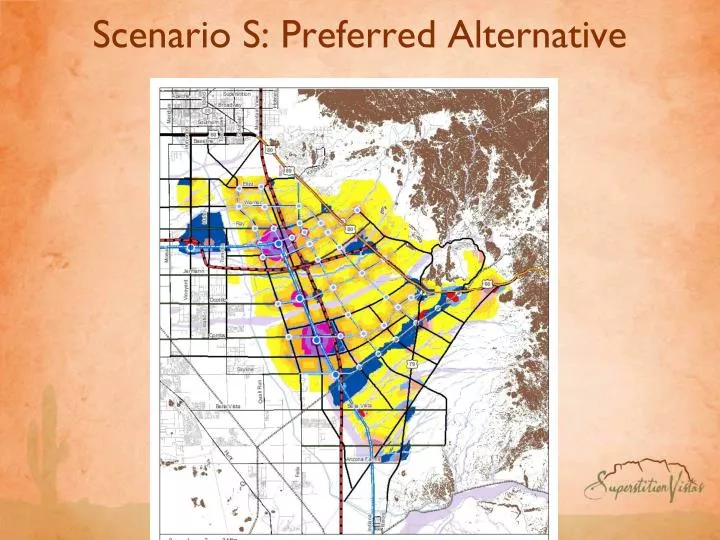
Scenario S: Preferred Alternative. Scenario S: Creating Mixed-use Centers Around Major Transportation Areas Is The Primary Driver Of Improved Transportation Performance. Plan a range of mixed use centers around transit A few regional centers Many neighborhood centers

E N D
Scenario S:Creating Mixed-use Centers Around Major Transportation Areas Is The Primary Driver Of Improved Transportation Performance • Plan a range of mixed use centers around transit • A few regional centers • Many neighborhood centers • Close access to centers throughout the Vistas
Scenario S:Creating Mixed-use Centers Around Major Transportation Areas Is The Primary Driver Of Improved Transportation Performance • Plan a range of mixed use centers around transit • A few regional centers • Many neighborhood centers • Close access to centers throughout the Vistas
Scenario S:Creating Mixed-use Centers Around Major Transportation Areas Is The Primary Driver Of Improved Transportation Performance • Plan a range of mixed use centers around transit • A few regional centers • Many neighborhood centers • Close access to centers throughout the Vistas
Scenario S: Enhanced Network • 7 Bus corridors • Within ½ mile of transit: • 30% Households • 47% Jobs +28% +19%
Scenario X Land Use Parameters • Half the housing units and jobs of Scenario A • 202,500 Housing Units • 80% single family housing • Averaging about ~6 dwelling units per net acre (3-4 per gross), similar to single family prevalent in the Gold Canyon and San Tan Valley areas • 150,000 Jobs • Primarily strip commercial with some office • Retail and employment centers located at freeway and arterial intersections • Small amount of multi-family located around interchanges and employment centers • Less environmental sensitivity and open space • More encroachment into washes • Development on slopes • Fewer parks, more golf courses
Scenario X Transportation Parameters • No regional transit, limited local transit • Freeways built as planned • Highway 60 and 79 expanded to 6 lane expressways, but with surface intersections • Extension of existing major arterials • Follow conventional arterial pattern of one arterial per mile (use section lines)
Comparing Scenario S and X Scenario S: Preferred Alternative Scenario X: Basecase
Transportation Emissions (CO2)Tons of CO2 per Year Per Capita
Housing Mix Comparison Scenario X continues current trends, Scenario S anticipates future demographic shifts and changing housing needs.
Building Emissions (CO2)Annual CO2 (ton/yr) Building emissions are lower in Scenario X because employment buildings use more energy
Building Emissions (CO2)Annual CO2 (ton/yr) Per Capita Building emissions are lower in Scenario X because employment buildings use more energy
Total Water Demand(Gallons/day - Building and Landscaping) Per Capita