Download
1 / 39
400 likes | 558 Views
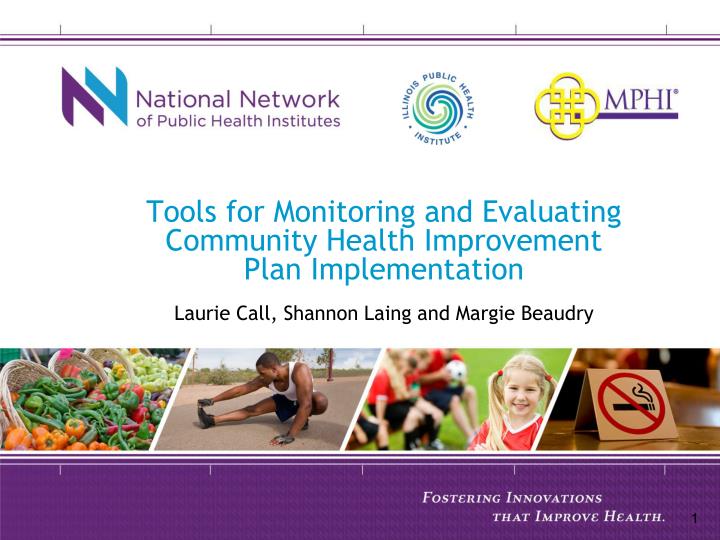
Tools for Monitoring and Evaluating Community Health Improvement Plan Implementation Laurie Call, Shannon Laing and Margie Beaudry. Learning Objectives. Participants will be able to…

E N D
Tools for Monitoring and Evaluating Community Health Improvement Plan Implementation Laurie Call, Shannon Laing and Margie Beaudry
Learning Objectives • Participants will be able to… • Describe strengths and weaknesses of various tools/processes for monitoring and evaluating community health improvement implementation. • Consult with community groups on selecting tools/processes for monitoring and evaluating implementation. • Identify ways to support community evaluation efforts.
Rationale and Challenge Do we really have to implement this plan? Do we really have to measure and report what we are doing?
PHAB Requirements for CHIP Implementation and Monitoring David Stone Education Services Public Health Accreditation Board
CHIP Implementation • Measure 5.2.3 A • Record of Actions Taken • Health Department and/or partners • Link back to location in CHIP
CHIP Monitoring • Measure 5.2.4 A • Annual Reports • Monitoring • Evaluating • Revising • What if the plan is too new • Links to Domain 9??
Group Discussion – Root Causes • Why don’t they measure their work? • With those root causes in mind, what infrastructure and process(es) needs to be in place for measurement to occur? • What infrastructure and process(es) need to be in place for accountability and sharing/monitoring data?
Collective Impact: Five Key Elements • Common understanding of the problem • Shared vision for change COMMON AGENDA • Collecting data and measuring results • Shared accountability SHARED MEASUREMENT MUTUALLY REINFORCING ACTIVITIES • Evidence-based/Evidence-informed approaches • Coordination through joint plan of action • Consistent and open communication • Clear decision making processes • Focus on building trust CONTINUOUS COMMUNICATION • Separate organization(s) with dedicated staff • Resources/skills to convene and coordinate BACKBONE SUPPORT Source: Kania, J. and Kramer, M., Collective Impact, Stanford Social Innovation Review, 2011.
Why do measurement systems fail? • Impose management measures on the performing group instead of allowing the group to establish the measures • Do not involve process owners and those who know the most about the process in developing the measurement systems • Treat measurement information and trends as private data and do not share the information with the group • Fail to recognize and reward performance improvement • Fear exposing good or bad performance. The group may be satisfied with the status quo and not want to upset anyone.] • Improperly define the system or process to be measured • Spend too much time on data gathering and reporting and not enough time on analysis and action • Fail to consider customer requirements Malcolm Baldridge National Quality Award Office
Helping Clients Determine Needs • What are you already doing to collect data, document your work etc.? • What resources do you have? • How often will you be able to come together to look at data? • What existing reliable data do you already have? • Where can you start measuring a couple indicators fairly easily and accurately? • Where do you have measurement expertise, capacity and time? • Others?
Infrastructure to Support Monitoring • Evaluation and Monitoring Team • Evaluation and Monitoring Focus/ Expertise on Action Teams • Oversight / Accountability Mechanism • Plans for How Results Will be Used
Basic Monitoring Infrastructure • Establish a team responsible for monitoring progress of • activities and process data • objectives and outcome indicators • Report out progress information to steering committee or governing committee and all partners. • monthly, every 3 months, every 6 months or annually • depending on when outcome and performance data are available. • Hold assessment sessions to discuss “How are we doing?” • What is going well? Why? • What is not going well? Why? • What changes or improvements are needed regarding the activities? • Develop a plan and implement changes or improvements The key is to develop a monitoring process to provide continuous feedback to make changes/ improvements when necessary.
Sample Tool for Documenting Activity • Activity Trackers help: • Create a norm; expectation. • Integrate monitoring into existing processes • Provide basic tool to document all the activity going on related to a particular issue. • Keep the focus of the committee/ action team on the priority issue. • Identify improvement opportunities and successes. • Provide structured opportunity for group problem-solving. Tool Developed by MPHI
Sample Tool for Documenting Activity • Basic tool; easy to adapt. • One place to record actions from all participating agencies and groups. • Ability to track activity before measurement. • Linked directly to outcome objectives. Tool Developed by MPHI
Sample Tool • Monitoring evaluation processes is also important • Simple Excel worksheet for each CHIP priority area • Aligns evaluation methods with CHIP priority areas • Documents evaluation findings specific to each priority area on an ongoing basis to enable quality improvement Tool Developed by MPHI
Logic Models • The Tearless Logic Model - http://www.gjcpp.org/en/tool.php?issue=7&tool=9 • Label flipchart pages for sets of questions/ LM components • If we got it right, what would it look like? (anticipated impacts, end in mind) • Who is being helped? (target populations or those we serve) • What rules need changed? (long-term outcomes, policy changes, changing the rules or nature of the game) • Who would change and how? (intermediate outcomes, behavioral outcomes) • What are the first things that need to change? (short-term outcomes, what needs to change now?) • What must be done? (activities) • What can be measured? (outputs, what can be counted) • What can we do to make it happen? (inputs or resources, what do we need to make it happen)
Another look… IPHI
Implementation Plans IPHI Sample
Components in a Measurement Plan • Process and outcome indicators • Data sources for measuring the indicators • Methods for measurement • Person Responsible for Data • Timing for measurement • Baseline • Target
Measurement Plans IPHI Sample
Dashboards http://www.michigan.gov/midashboard/0,4624,7-256-59026---,00.html Michigan.Gov Dashboard
Key Evaluation Activities • Prepare to evaluate • Engage Stakeholders to develop and gain consensus around your evaluation plan • Review policy or program goals and decide which are most important to evaluate • Identify indicators and how to collect data to monitor progress • Identify benchmarks for success • Work with key parties to establish data collection systems • Collect credible data • Monitor progress toward achieving benchmarks • Engage stakeholders to review evaluation results and adjust your policy implementation or program(s) as necessary • Share your results http://www.countyhealthrankings.org/roadmaps/action-center/evaluate-actions
Institute Roles in Supporting Evaluation Efforts • How is your Institute supporting evaluation of community health improvement? • What’s working? (tools, processes, methods, etc.) • What are the challenges and barriers?
How QI Tools Can Support Measurement Activities Margie Beaudry Director, Performance Management & Quality Improvement Public Health Foundation
How QI Tools Can Support Measurement Activities • PHF and National Network of Public Health Institutes • A menu of 25 tools potentially to use at progressive stages of measurement and data monitoring • Purpose and applicability of each tool • Fitting tool selection and application to each unique circumstance • Discovering where multiple tools can work together effectively; we welcome comments based on users’ experience • A working document that is meant to prompt experimentation • Comments on drafts of the tool provided by CDC, and Performance Improvement Managers from Houston, Kansas, Kentucky, Maine, Maricopa County
Stages of Measurement • Choosing Measures - Identifying the factors that the program aims to impact, and therefore what to measure in evaluating a project • Choosing Indicators - Choosing the specific metrics and indicators that reflect performance on target measures • Managing Data Quality - Putting safeguards in place to help ensure that data gathered are reliable and valid, and truly represent the target measures • Analyzing and Interpreting Data - Knowing how to “crunch” the numbers and makes sense of trends in the data
Choosing Measures • Identifying the factors that the program aims to impact, and therefore what to measure in evaluating a project • Affinity Diagram • AIM Statement • Brainstorming • Cause and Effect Diagram/Fishbone • Five Whys • Force & Effect Diagram • Pareto Chart • PEST Chart • SMART Matrix • Voice of the Customer
Choosing Indicators • Choosing the specific metrics and indicators that reflect performance on target measures • AIM Statement • Control & Influence Matrix • Force & Effect Diagram • Nominal Group Technique • Prioritization Matrix • Tree Diagram
Managing Data Quality • Putting safeguards in place to help ensure that data gathered are reliable and valid, and truly represent the target measures • Cause and Effect Diagram/Fishbone • Check Sheet • Control Chart • Critical Path Analysis • Flowchart • Gantt Chart • PDCA Cycle • Stop-Start-Continue-Improve Matrix
Example: Cause and Effect Diagram • Use to organize ideas about potential causes of observed effects. • Helps to create of map of multiple causes contribute to an effect. • Sometimes called a Fishbone Diagram ThePublic Health Quality Improvement Encyclopedia, Public Health Foundation, 2012.
Analyzing and Interpreting Data • Knowing how to “crunch” the numbers and makes sense of trends in the data • Control Chart • Radar Chart • Run Chart • Scatter Diagram • Variation Plot
Example: Run Chart • Use to display performance data over time • Use to assess data stability • Use to pinpoint areas needing improvement ThePublic Health Quality Improvement Encyclopedia, Public Health Foundation, 2012.
Just a Starting Place • Fitting tool selection and application to each unique circumstance • Discovering where multiple tools can work together effectively • A working document that is meant to prompt experimentation • We welcome comments based on users’ experience and observations
Performance Management Framework Source: From Silos to Systems: Using Performance Management to Improve Public Health Systems – prepared by the Public Health Foundation for the Performance Management National Excellence Collaborative, 2003. Updated framework by the Public Health Foundation, 2013.
Contact Information Margie Beaudry Director, Performance Management & Quality Improvement Public Health Foundation 202-218-4415 Email: mbeaudry@phf.org Website: www.phf.org
Contact Information Laurie Call Center for Community Capacity Development Illinois Public Heath Institute Laurie.call@iphionline.org 312.850.4744 or 217.679.2827 Shannon Laing, MSW Center for Healthy Communities Michigan Public Heath Institute slaing@mphi.org 517-324-7344