Download
1 / 18
210 likes | 400 Views
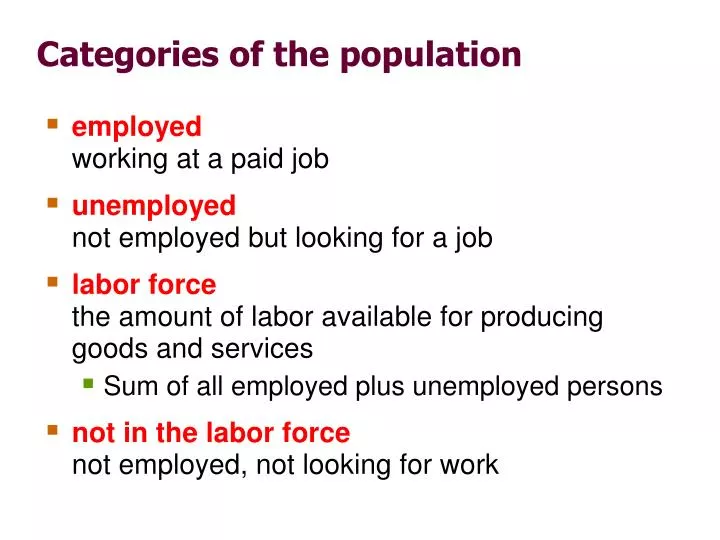
Categories of the population. employed working at a paid job unemployed not employed but looking for a job labor force the amount of labor available for producing goods and services Sum of all employed plus unemployed persons

E N D
Categories of the population • employed working at a paid job • unemployed not employed but looking for a job • labor force the amount of labor available for producing goods and services • Sum of all employed plus unemployed persons • not in the labor forcenot employed, not looking for work
Two important labor force concepts • unemployment rate percentage of the labor force that is unemployed • labor force participation rate the fraction of the adult population that “participates” in the labor force • employment population ratio employment divided by adult population
NOW YOU TRY: Computing labor statistics U.S. adult population by group, May 2009 Number employed = 140.57 million Number unemployed = 14.51 million Adult population = 235.45 million Use the above data to calculate • the labor force • the number of people not in the labor force • the labor force participation rate • the unemployment rate
NOW YOU TRY: Computing labor statistics U.S. adult population by group, Aug 2013 Number employed = 144.17 million Number unemployed = 11.32 million Adult population = 245.96 million Use the above data to calculate • the labor force • the number of people not in the labor force • the labor force participation rate • the unemployment rate • Employment population ratio
Answers • data: E = 144.17, U = 11.32, POP = 245.96 • labor forceL = E +U = 144.17 + 11.37 = 155.49 • not in labor forceNILF = POP– L = 245.96 – 155.49 = 90.47 • unemployment rateU/L x 100% = (11.32/155.49) x 100% = 7.3% • labor force participation rateL/POP x 100% = (155.49/ 245.96) x 100% = 63.22%
How Unemployment is Measured unemployment rateThe percentage of the labor force that is unemployed. • Computing the unemployment rate for December 2013. • Dec 2013 • Labor force: 154.937 million • Employed: 144.586 million • Unemployed: 10.351 million • Population 246.745 million Unemployment rate2012 = LFPR = .628 in Dec 2013. If LFPR had remained at Dec2012/Jan2013 level of .636, LF = 156.929 (.623 x 246.745) and U/L = 12.34/156.929 = 7.8%
The Duration of Unemployment http://www.bls.gov/news.release/pdf/empsit.pdf Table A-12
Problems in Measuring Unemployment • Official measure of unemployment • Underestimates the extent of unemployment • Treatment of involuntary part-time workers • Treatment of discouraged workers • Involuntary part-time workers • Individuals who would like a full-time job but who are working only part time • Discouraged workers • Individuals who would like a job but have given up searching for one
Problems in Measuring Unemployment • BLS policy: discouraged worker if • Not working • Searched for a job at some point in the last 12 months • Currently want a job • State that the only reason they are not currently searching for work is their belief that no job is available for them
Discouraged-Worker Effects discouraged-worker effect The decline in the measured unemployment rate that results when people who want to work but cannot find jobs grow discouraged and stop looking, thus dropping out of the ranks of the unemployed and the labor force. It lowers the unemployment rate!
Problems in Measuring Unemployment • Marginally attached to the labor force • Meet the first three requirements of discouraged workers • But not necessarily the fourth: • They can give any reason for not currently searching for work
Alternative Measures of Employment Conditions • The Six “U”s • Six different unemployment rates • Each labeled with a “U” followed by a number • “U-3”: the official unemployment rate • The Establishment Survey • BLS surveys business establishments to track the number of jobs that have been added and lost
The Six “U”s http://www.bls.gov/news.release/pdf/empsit.pdf Table A-15
Alternative Measures of Employment Conditions • The employment-population ratio • Total employment (from the household survey) divided by the total population over age 16 • Tracks the fraction of the adult population that is working • not affected by job-searching behavior
The establishment survey • The BLS obtains a second measure of employment by surveying businesses, asking how many workers are on their payrolls. • Neither measure is perfect, and they occasionally diverge due to: • treatment of self-employed persons • new firms not counted in establishment survey • technical issues involving population inferences from sample data
Two measures of employment growth Percentage change from 12 months earlier