Download
1 / 44
440 likes | 569 Views
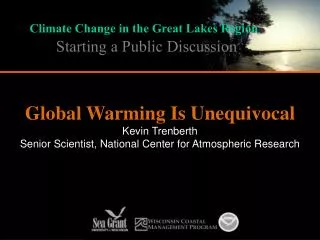
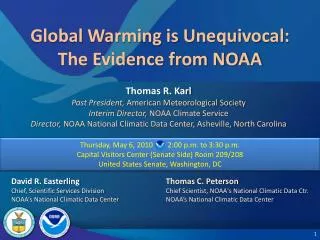
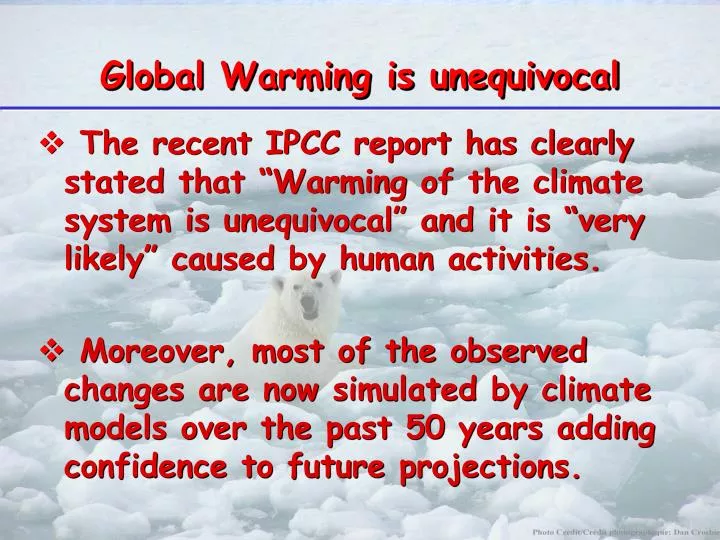
Global Warming is unequivocal. Kevin E Trenberth NCAR. The recent IPCC report has clearly stated that “Warming of the climate system is unequivocal” and it is “very likely” caused by human activities.

E N D
Global Warming is unequivocal Kevin E Trenberth NCAR • The recent IPCC report has clearly stated that “Warming of the climate system is unequivocal” and it is “very likely” caused by human activities. • Moreover, most of the observed changes are now simulated by climate models over the past 50 years adding confidence to future projections.
Key issue for transportation: What is your carbon footprint? Wgtn 4 Jul 07
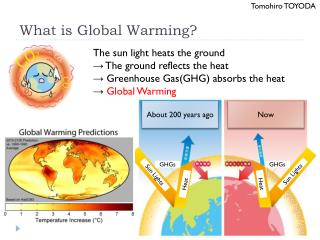
Climate The atmosphere is a “global commons.” Air over one place is typically half way round the world a week later, as shown by manned balloon flights. The atmosphere is a dumping ground for all nations for pollution of all sorts. Some lasts a long time and is shared with all.One consequence is global warming!
Changing atmospheric composition: CO2 Mauna Loa, Hawaii Data from Climate Monitoring and Diagnostics Lab., NOAA. Data prior to 1973 from C. Keeling, Scripps Inst. Oceanogr.
CO2 emissions in different regions in 2000 in terms of emissions per capita (height of each block); population (width of each block); and total emissions (product of population and emissions per capita = area of block). Source: M. Grubb, http://www.eia.doe.gov/iea/
The Natural Greenhouse Effect: clear sky CH4 N20 6% O3 8% Water Vapor 60% Carbon Dioxide 26% Clouds also have a greenhouse effect Kiehl and Trenberth 1997
Global Warming is unequivocal Since 1970, rise in:Decrease in: • Global surface temperatures NH Snow extent • Tropospheric temperatures Arctic sea ice • Global SSTs, ocean Ts Glaciers • Global sea level Cold temperatures • Water vapor • Rainfall intensity • Precipitation extratropics • Hurricane intensity • Drought • Extreme high temperatures • Heat waves
Warmest 12 years: 1998,2005,2003,2002,2004,2006, 2001,1997,1995,1999,1990,2000 25 0.1770.052 50 0.1280.026 100 0.0740.018 150 0.0450.012 Global mean temperatures are rising faster with time Period Rate Years /decade
Land surface temperatures are rising faster than SSTs SST Land Annual anomalies of global average SST and land surface air temperature
Controlling Heat Human body: sweats Homes: Evaporative coolers (swamp coolers) Planet Earth: Evaporation (if moisture available) e.g., When sun comes out after showers, the first thing that happens is that the puddles dry up: before temperature increases.
Observations show that this is happening at the surface and in lower atmosphere: 0.6C since 1970 over global oceans and 4% more water vapor. This means more moisture available for storms and an enhanced greenhouse effect. Total water vapor Air holds more water vapor at higher temperatures A basic physical law tells us that the water holding capacity of the atmosphere goes up at about7% per degree Celsius increase in temperature.
Increases Decreases Land precipitation is changing significantly over broad areas Smoothed annual anomalies for precipitation (%) over land from 1900 to 2005; other regions are dominated by variability.
Proportion of heavy rainfalls: increasing in most land areas Regions of disproportionate changes in heavy (95th) and very heavy (99th) precipitation
Declining Snow Pack in many mountain and continental areas contributes to drought • moreprecipitationfalls as rain rather than snow, especially in the fall and spring. • snow meltoccurs faster and sooner in the spring • snow packis therefore less • soil moistureis less as summer arrives • the risk of droughtincreases substantially in summer • Along with wild fire
Drought is increasing most places Mainly decrease in rain over land in tropics and subtropics, but enhanced by increased atmospheric demand with warming The most important spatial pattern (top) of the monthly Palmer Drought Severity Index (PDSI) for 1900 to 2002. The time series (below) accounts for most of the trend in PDSI.
Rising greenhouse gases are causing climate change, and arid areas are becoming drier while wet areas are becoming wetter. Water management:- dealing with how to save in times of excess for times of drought – will be a major challenge in the future. Lake Powell
Heat waves and wild fires Impacts on human health and mortality, economic impacts, ecosystem and wildlife impacts
Extremes of temperature are changing! Observed trends (days) per decade for 1951 to 2003: 5th or 95th percentiles From Alexander et al. (2006)
Trend plus variability? Heat waves are increasing: an example Extreme Heat Wave Summer 2003 Europe 30,000 deaths
Increases in rainfall and cloud counter warming Drought Absence of warming by day coincides with wetter and cloudier conditions Trend in Warm Days 1951-2003
Marked increase after 1994 North Atlantic hurricanes have increased with SSTs N. Atlantic hurricane record best after 1944 with aircraft surveillance. Global number and percentage of intense hurricanes is increasing (1944-2005) SST
Sea level is rising: from ocean expansion and melting glaciers • Since 1993 • Global sea level • has risen 41 mm • (1.6 inches) • 60% from • expansion as ocean temperatures rise, • 40% from melting glaciers • Steve Nerem
Evidence for reality of climate change Glaciers melting Muir Glacier, Alaska 1909 Toboggan Glacier Alaska 2000 1900 2003 Alpine glacier, Austria
Snow cover and Arctic sea ice are decreasing Spring snow cover shows 5% stepwise drop during 1980s Arctic sea ice area decreased by 2.7% per decade (Summer: -7.4%/decade)
Surface melt on Greenland Increasing melt zones. Melt descending into a moulin: a vertical shaft carrying water to the base of the ice sheet. NSIDC (above) Braithwaite: Univ. Manchester
Natural forcings do not account for observed 20th century warming after 1970 Meehl et al, 2004: J. Climate.
Projected Patterns of Precipitation Change 2090-2100 Precipitation increases very likely in high latitudes Decreases likely in most subtropical land regions This continues the observed patterns in recent trends Summary for Policymakers (IPCC AR4)
Context: 400,000 years of Antarctic ice core records of Temperatures, Carbon dioxide and Methane. Last ice age glacial: 20,000 years ago Source: Hansen, Climatic Change 2005, based on Petit, Nature 1999
CO2 Temp.
The UN Framework Convention on Climate Change • Ratified by 189 countries • Ratified by the US • Article 2 is statement of the objective • Convention entered into force 21 March 1994
Kyoto Protocol • A legal instrument under UNFCCC • Requires net reduction in developed country averaged annual GHG emissions of 5% (US 7%) over the period 2008-12 compared to 1990 levels • “Basket” of GHGs (CO2, CH4, N2O, HFCs, PFCs, SF6) • Provisions for “flexible” market mechanisms: international trading system, credits, etc. • 164 countries have ratified • Protocol was ratified; took effect Feb 16, 2005. • US withdrew in 2001.In 2004 US emissions were 16% (20%) over 1990 levels for GHG (CO2).
What about a carbon tax? Anyone can burn stuff and put Carbon Dioxide into the atmosphere as a waste product. If there was a value to Carbon Dioxide then this would presumably be reduced. A carbon tax, carbon emission limits, or pollution fines are designed to create acostfor burning carbon products, like coal and oil. Given atarget(such as in the Kyoto Protocol) only so much can be burned andcreditsto allow burning canbe traded(carbon emissions trading). Such a solution can beequitableif implemented across the board. But it can favor those who pollute if a country does not subscribe.
Recent trends: March 2007 Coal fired power stations have been brought on line at a rate of 2 per week over the past 5 years. China leads with one every 3 days or so last years (560 new plants from 2002 to 2006 and 113 GigaWatts of coal fired power). (200 MW each) In the next 4 years, China is expected to bring online over 55 GW of coal fired power, but the US is right behind with 38 GW, and India with 36 GW, and the rest of the world 47 GW. (Total 176 GW) Far from decreasing carbon dioxide emissions, the trend is much worse than what is assumed as “business as usual”. Christian Science Monitor: March 22, 2007
Recent trends: May 2007 In the U.S. transportation makes up about 33% of carbon dioxide emissions (source EIA)
Recent trends: May 2007 In 2030 global emissions will likely be up by 59% relative to 2004 according to the U.S. Energy Information Administration in its annual International Energy Outlook in May 2007.
Global Warming The Kyoto Protocol basically calls for a freeze on emissions to 1990 levels for developed countries. Similarly, the Montreal Protocol for ozone depletion initially called for a freeze on CFC emissions and only later was this changed to a phase out. A freeze on emissions means that concentrations of carbon dioxide continue to increase.Climate continues to change, temperatures rise and sea level continues to rise.
Global Warming We can slow global warming down! Disruption arises more from rapid change than from the climate per se. Mitigation effects mainly payoff beyond 2050. So wemustadapt to climate change: we will adapt, whether unplanned (disruptive untold damage and loss of life), autonomously, or planned.
3 Key questions: • How would you or your activity respond to a carbon tax? • How can you reduce your carbon footprint? • How can you be part of the solution, not part of the problem?
Before After