Download
1 / 6
60 likes | 147 Views
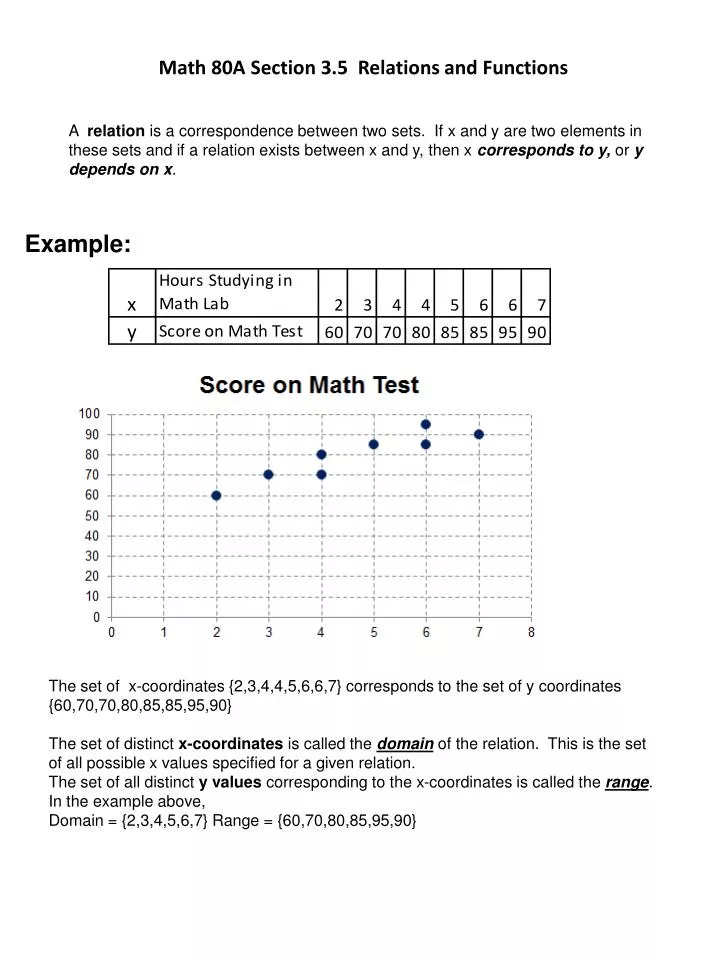
Math 80A Section 3.5 Relations and Functions. A relation is a correspondence between two sets. If x and y are two elements in these sets and if a relation exists between x and y, then x corresponds to y, or y depends on x. Example:.

E N D
Math 80A Section 3.5 Relations and Functions A relation is a correspondence between two sets. If x and y are two elements in these sets and if a relation exists between x and y, then x corresponds to y, or y depends on x. Example: The set of x-coordinates {2,3,4,4,5,6,6,7} corresponds to the set of y coordinates {60,70,70,80,85,85,95,90} The set of distinct x-coordinates is called the domain of the relation. This is the set of all possible x values specified for a given relation. The set of all distinct y values corresponding to the x-coordinates is called the range. In the example above, Domain = {2,3,4,5,6,7} Range = {60,70,80,85,95,90}
FUNCTIONS Input x Function f(x) Output y • A function, f, is like a machine that receives as input a number, x, from the domain, manipulates it, and outputs the value, y. • The function is simply the process that x goes through to become y. This “machine” has 2 restrictions: • It only accepts numbers from the domain of the function. • For each input, there is exactly one output (which may be repeated for different inputs). “OFFICIAL” DEFINITION OF A FUNCTION: Let X and Y be two nonempty sets. A function from X into Y is a relation that associates with each element of X, exactly one element of Y. However, an element of Y may have more than one elements of x associated with it. That is, for each ordered pair (x,y), there is exactly one y value for each x, but there may be multiple x values for each y. The variable x is called the independent variable (also sometimes called the argument of the function), and the variable y is called dependent variable (also sometimes called the image of the function.) Analogy: In the x-y “relation”-ship, the x’s are the wives and the y’s are the husbands. A husband is allowed to have two or more wives, but each wife(x) is only allowed 1 husband(y). This relation is not a function because there are two different y-coordinates for the x-coordinate, 4, and also for the x-coordinate, 6.
Example: Given the relation {(-2,-3),(2,3),(-1,2),(-3,4),(3,4)} Is this relation a function?_______________ (does any one x-value have more than one corresponding y value?) What is the domain? -3,-2, -1, 2, 3 What is the range? -3, 2, 3, 4 Example: Given the relation {(-4,4),(-2,2),(0,0),(-2,-2)} Is this relation a function?_______________ (does any one x-value have more than one corresponding y value?) What is the domain?___________________ What is the range?______________________
A relation is not a function of x if there is more than one corresponding y-value for any x-value. To be a function of x, put the relation in the form y = ___ and there should be only 1 possible solution for any one x-value. Example 6 p. 202 Are these functions of x? x = y2 y can be or Not a function of x. y = 2x There is only 1 possibility for any x. So YES. it is a function of x. x = |y| Solve for y. x = y or x = -y y = x or y = -x Two possibilities, therefore NOT A FUNCTION.
VERTICAL LINE TEST A graph is the graph of a funciton if and only if there is no vertical line that crosses the graph more than once.
Example Consider the equation for the line segment: y = 2x – 5, where the domain is {x|1 ≤ x ≤ 6} Is this equation a function? Notice that for any x, you can only get one answer for y. (E.g. when x =1, then y = 2(1) – 5= -3.) Therefore the equation is a function. Functional notation for this equation would be f(x) = 2x – 5 Just replace the y with f(x). Note: This is stated “f of x”, It does not mean f times x, though it looks like that. What is the range? Since this is a straight line, we need only check y values at endpoints of domain. The y values do not fluctuate between these endpoints. The y values are also called function values, so they are often referred to as f(x), which means the value of the function at x (not f times x). The endpoints of the domain are 1 and 6. f(1) = the value of the function (what is y?) when x = 2 = 2(1) – 5 = -3 f(6) = the value of the function (what is y?) when x = 6 = 2(6) – 5 = 7 So the range is {y|-3 ≤ y ≤ 7} Example Find the range of the function given by the equation f(x) = -3x + 2 if the domain is {-4,-2,0,2,4}. Recall domain means possible x-values. The ordered pairs that belong to this function are graphed to the right. They are: {(-4,14), (-2,8), (0,2),(2,-4),(4,-10)} Range means possible y values, so Range = {-10,-4,2,8,14} This figure is a line segment with endpoints (1,-3) and (6,7).